LINTag User Manual
- High-Throughput Streaming Time-to-Digital Converter
Photonscore GmbH · Software v2.8.1
Safety measures
Warning
Never disconnect power supply unit from the LINTag when connected to the wall power. Switch off and unplug the supply at the mains first; disconnecting under load can damage the instrument.
Warning
Static electricity may damage the inputs. The LINTag contains electrostatic-sensitive components: handle it and its connectors in an ESD-safe manner, using a grounded wrist strap and an ESD-protected work surface, and avoid touching the signal connectors directly.
Warning
Do not exceed input voltages (−2.0 to 2.5 V) on any channel. Applying voltages outside this range can permanently damage the input stages and/or FPGA.
Warning
Do not cover the system fans. The LINTag is force-air cooled through the rear-panel fans; keep their airflow path clear when rack-mounting or operating on a bench to prevent overheating.
Warning
Please use only supplied PSU or exact part. Using a non-approved power supply can be dangerous, may damage the instrument, and voids the warranty.
1 Introduction and Overview
LINTag is a time-tagger system from Photonscore GmbH built for ultra-fast, high-throughput single-photon data acquisition. At its core is a time-to-digital converter (TDC) with eight acquisition channels, each offering an adjustable input threshold. The system streams up to 400 million time-tags per second to a host computer over a 10G Ethernet connection using a full-stack TCP/IP interface.
Each detected event is timestamped with a temporal accuracy of 8.5 ps FWHM (3.6 ps RMS) and a digital bin size of 1 ps. For latency-critical and high throughput applications, an embedded PC can access time tags directly from the FPGA, bypassing the tagger to host network path.
System overview
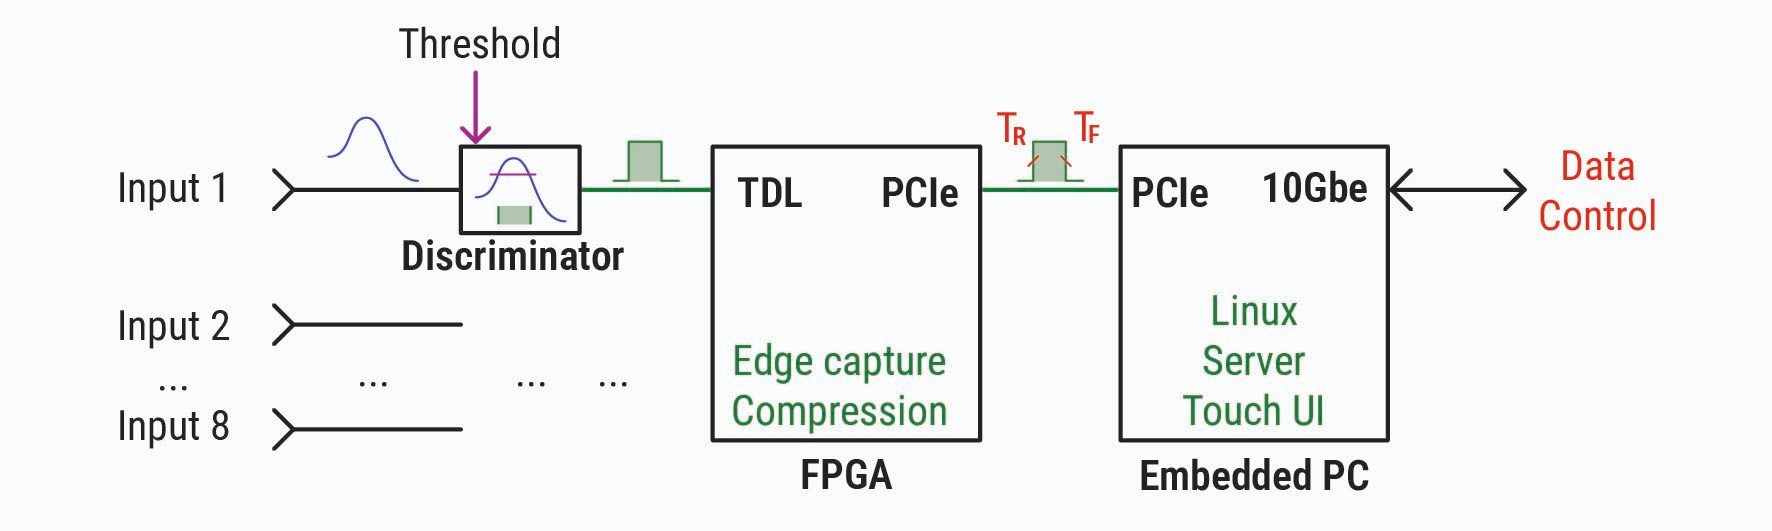
The figure traces a single signal from input to host. Each of the eight analog inputs is fed into a discriminator, which converts it to a digital pulse at a user-defined threshold. The discriminator outputs drive a tapped delay-line (TDL) inside the FPGA, where the arrival time of each edge is captured — TR for the rising edge and TF for the falling edge — and the resulting time tags are compressed. Depending on the channel settings, some or all tags are then transferred over the PCIe bus into the embedded PC's RAM by direct memory access (DMA) core. The embedded PC runs Linux and hosts both a server and the touchscreen user-interface software; over its 10G Ethernet link it streams tags data and telemetry to the user's host PC and receives control commands in return.
The LINTag uses a completely open architecture, so you are not limited to streaming tags to an external host. When required, the embedded PC can run your own software directly on the instrument, which opens two lower-latency access paths. First, your program can connect to the on-board server over a local network connection on the embedded PC itself, avoiding the round trip and overhead of the external 10G Ethernet link. Second, for the lowest possible latency — for example in feedback experiments — your code can read the time tags directly from RAM as soon as the FPGA has transferred them by DMA, bypassing the server entirely. See "Low-latency operation with the embedded PC" for details.
Key capabilities
- Eight acquisition channels, each with an independently adjustable input threshold (−2.0 to 2.5 V) and edge polarity
- Timing accuracy of 8.5 ps FWHM / 3.6 ps RMS with a 1 ps digital bin size
- Sustained tag transfer rate of up to 400 MTags/s and 10 GTags of on-board burst memory
- Maximum input frequency of 550 MHz per channel
- Embedded Intel 13th Gen Core i7 PC for on-device processing and low-latency FPGA access
- 10G Ethernet SFP+ connectivity with a full-stack TCP/IP interface, plus USB 3.0 and Thunderbolt 3
- Cross-platform host software for Windows (64-bit), macOS, and Linux, scriptable from Python, MATLAB, and .NET
Specifications at a glance
| Parameter | Value |
|---|---|
| Acquisition channels | 8 |
| RMS jitter | 3.6 ps |
| FWHM jitter | 8.5 ps |
| Digital bin size | 1 ps |
| Maximum input frequency | 210 MHz |
| Tag transfer rate | 380 MTags/s |
| Burst memory | 10 GTags |
| Embedded computing | Intel 13th Gen Core i7 |
| Input signal level | −2 to 2.5 V |
| Input impedance | 50 Ω / Hi-Z (1 MΩ) |
| Input polarity | Negative / Positive |
| External clock input | 10 MHz or 50 MHz |
| Power supply | 24 V, 12.5 A |
| Dimensions (W × D × H) | 480 × 345 × 133 mm (3U rack) |
| Connectivity | 10G Ethernet USB4 / Thunderbolt SFP+ adapter |
| Operating systems | Windows (64-bit), macOS, Linux |
2 Getting Started
This section walks you through the steps required to take your LINTag from unboxing to a first measurement. The procedure assumes the device, its power supply, and the host computer are all available. If you are integrating LINTag into an existing acquisition setup, read the Hardware and Installation sections first. What is in the box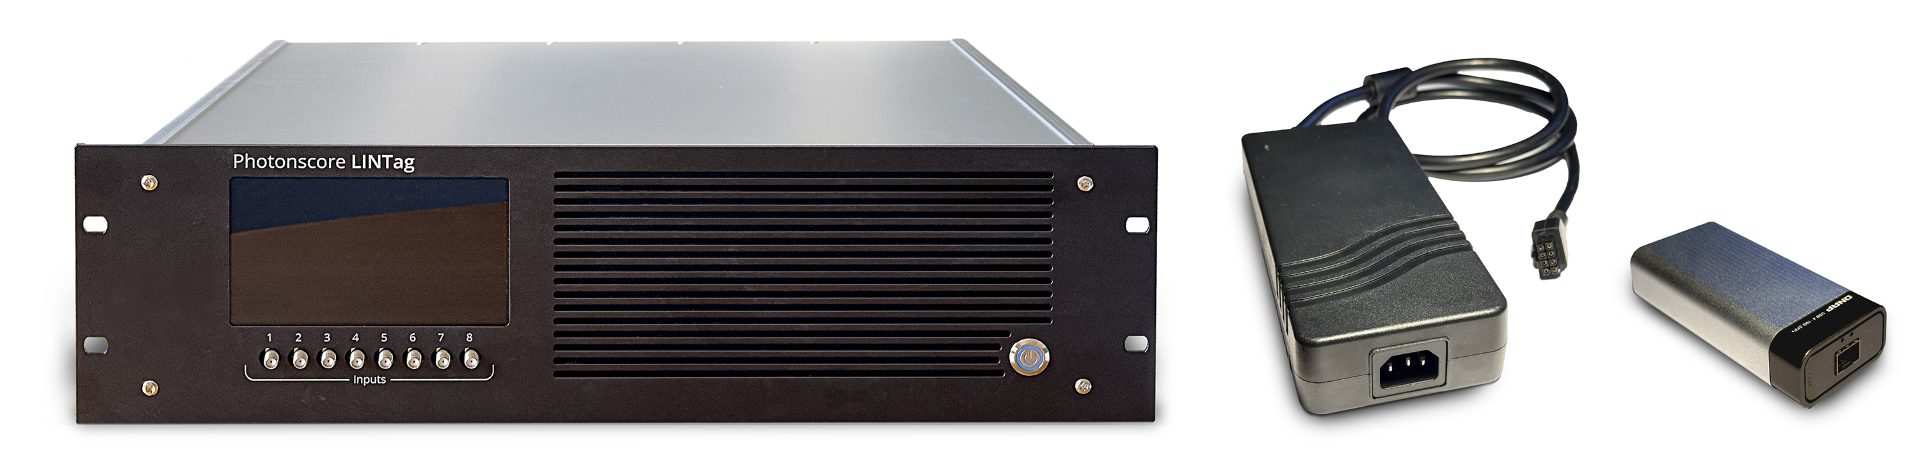
Depending on your order, we additionally provide the following accessories:
- A mains power cable for the PSU, matched to your country-specific plug type.
- Two SFP+ transceivers in your preferred medium — copper (direct-attach) or fibre optic — for the 10G Ethernet data link.
Quick start checklist
Follow these steps in order. Each step is expanded in the referenced section.
- Install the LINTag and connect power supply unit to the module, provided SFP+ data link, and HDMI cable. Optionally USB4 or Thunderbolt 10Gbe adapter to the host or use available 10Gbe connection in your computer — see Hardware.
Warning
Observe the power-up sequence: connect the power supply unit to the LINTag module first, and only then plug it into the wall mains. Never connect the PSU to the wall before it is attached to the module, and never disconnect it under load — switch off and unplug at the mains first. Applying power out of sequence can damage the instrument.
- Configure IP addresses on LINTag unit and your PC — see Installation.
- Install the host software: the LINTag Capture desktop application and (optionaly) the photonscore Python module — see Installation.
- Power on the device and launch LINTag Capture; confirm the device appears and reports a valid status.
- Connect a signal source to one of the eight inputs and configure the channel threshold, impedance, and edge — see Channel Configuration.
- Run a first correlation measurement to confirm timestamping, streaming the resulting tag stream to
.photonsfile — see The Correlator and File Writer.
3 Installation
LINTag is controlled from a host computer through two software components: the LINTag Capture desktop application, which provides the graphical interface and the on-line correlator and file writer, and the photonscore Python module, which scripts and remote-controls LINTag Capture. MATLAB bindings and a .NET library are also available. The software runs on Windows (64-bit), macOS, and Linux.
Network connection
Connecting the LINTag requires configuring the network on both the host PC and the device. On managed or corporate networks, however, standard user accounts often lack the administrative rights needed to change network adapter settings, assign IP addresses, or open firewall ports on the host PC.
Tip
If you are unsure whether you have the required permissions, contact your system administrator before you begin — they can assign the device's IP address, grant the necessary rights, and open the ports listed below for you.
The LINTag communicates with the host over a set of TCP ports. The primary connection point is the HTTP/2 port (10032), which LINTag Capture and the Python API use to reach the instrument; an HTTP/1 port (10031) is also available. In addition, the device exposes standard Telnet and FTP services for diagnostics and file transfer. The table below lists each service and its port number.
| Service | Port | Purpose |
|---|---|---|
| HTTP/2 | 10032 | Main connection point for LINTag Capture and the Python API |
| HTTP/1 | 10031 | Legacy HTTP connection |
| Telnet | 23 | Command-line diagnostics and device shell access |
| HTTP/1 | 80 | Device web-page for software download and device information. |
| FTP | 21, 20 | Control (21) and active-mode data (20); passive mode uses a server-assigned high port |
For maximum throughput, these ports run without transport-layer encryption and should be treated as unsecured. Use the LINTag only on a trusted local network and ask your system administrator to open the required ports on any firewall between the host PC and the device. The host operating system's own firewall may also block these ports — see your operating system user manual for instructions on creating the necessary inbound and outbound rules.
Whichever service you use, the host PC and the LINTag must be on the same subnet — that is, their IP addresses must share the same network portion, as defined by the subnet mask (the prefix length in CIDR notation). For example, with a /24 prefix the first three octets must match: a host at 192.168.68.10 and a device at 192.168.68.32 are on the same subnet, whereas 192.168.69.32 is not and will be unreachable. Assign the device's address in CIDR notation as described in the Network screen of the embedded software interface (see “Network” under Hardware → Embedded software interface) and make sure it falls within the host PC's subnet.
Benchmarking network connection
The LINTag streams time tags to the host continuously, so the network link between the device and your workstation must be able to sustain the full data rate without loss. You can measure the achievable throughput with iperf3, a tool that runs as a server on one machine and as a client on the other. The device's embedded PC already includes iperf3 and is reachable through its Telnet shell, so the device acts as the server and your workstation as the client.
First, open a Telnet session to the device using its IP address (the Telnet service listens on port 23):
telnet <device-ip>At the device shell, start iperf3 in server mode. It listens for an incoming connection on its default TCP port (5201):
iperf3 -sThen, on your workstation, run iperf3 as a client, pointing it at the device's IP address:
iperf3 -c <device-ip>By default, iperf3 runs a ten-second test and prints the measured bandwidth. Read the summary line: for reliable streaming, the sustained rate should comfortably exceed the data rate of your measurement. Add -t to lengthen the test (for example, iperf3 -c <device-ip> -t 30 for 30 seconds) and add -R to reverse the direction so that data flows from the device to the workstation — the same direction as the time-tag stream.
If the measured throughput is lower than expected, check that both the device and the host are linked at the intended speed (for example, 10 GbE), that the cabling and switch support that speed, that jumbo frames (a larger MTU), if used, are enabled consistently at both ends, and that no other traffic is competing on the link.
Expected results
A 10 Gigabit Ethernet (10GbE) link has a raw line rate of 10 Gbit/s, but not all of it is available for your data. Every packet also carries Ethernet framing, an inter-frame gap, and IP and TCP headers, none of which count as payload. With the standard 1500-byte MTU this overhead is about 5 %, so the ceiling for useful TCP throughput is roughly 9.4–9.5 Gbit/s rather than the full 10 Gbit/s.
A result of around 9.5 Gbit/s — typical for iperf3 on a well-configured Windows host — is therefore at the practical maximum for a 10GbE connection and indicates a healthy link; no further tuning is needed. Much lower readings point to a problem: about 1 Gbit/s usually means the link negotiated only 1 GbE, while a few Gbit/s with large variance suggests a cabling, switch, driver, or competing-traffic issue.
If you need the last few percent, enabling jumbo frames (a 9000-byte MTU) reduces the relative overhead and can raise TCP throughput to roughly 9.8–9.9 Gbit/s. Jumbo frames must be enabled consistently on the device, the host, and every switch in the path, or they will not take effect.
Software versioning
Releases follow semantic versioning (major.minor.patch). The Python module, MATLAB bindings, and desktop applications are published together for each version. This manual documents version 26.0.12. Per-platform downloads are organized at dl.photonscore.io under a uniform versioned layout. For example, all the files for the current release can be downloaded from https://dl.photonscore.io/26.0.12/.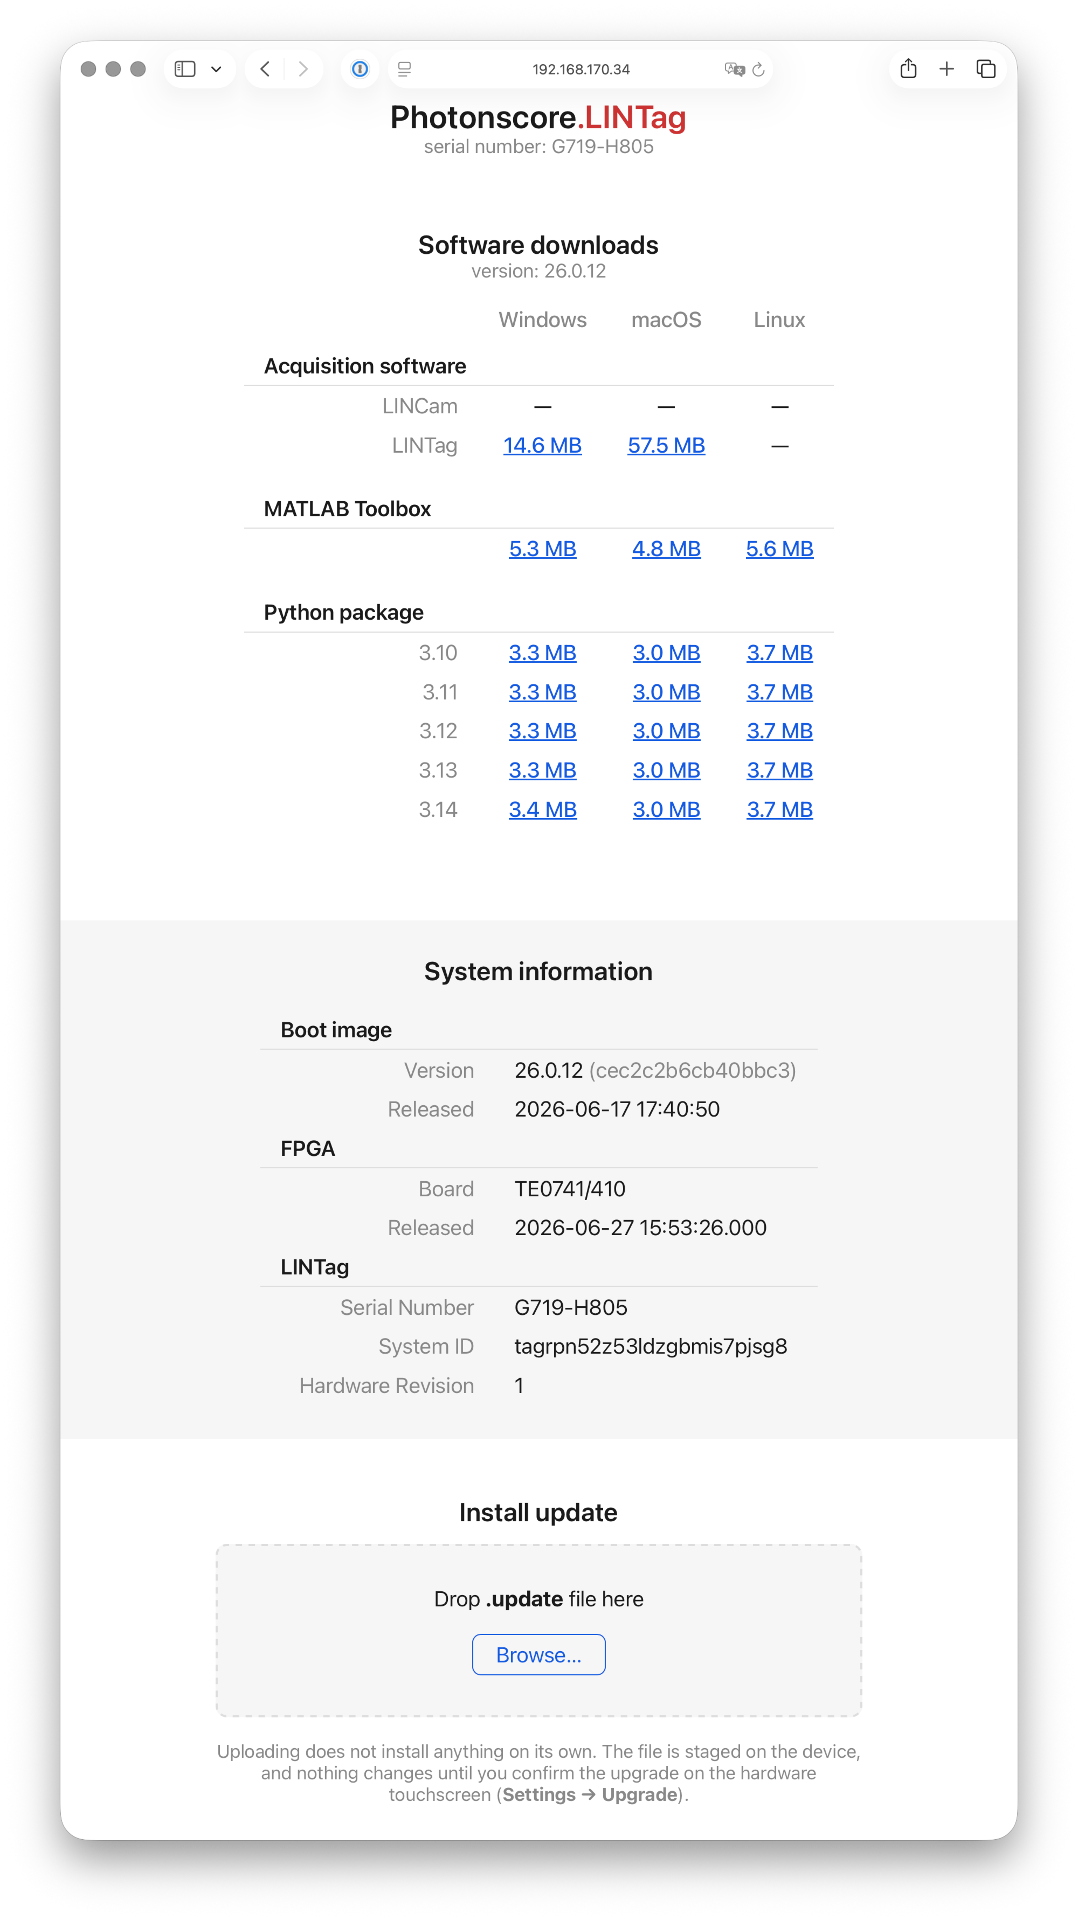
Installing the Photonscore Python module
Tip
You can install the module straight from the device — no need to look up versions on the download server. The LINTag web interface (Figure 3), reached at the device's IP address, lists the photonscore package for every supported platform and Python version, already matched to the unit's firmware. Click the link for your platform and Python version to download the archive, then install it with pip or uv exactly as shown below (pointing pip at the downloaded file or directly at its URL).
We support versions 3.10, 3.11, 3.12, 3.13 and 3.14. The module is available for Linux (x86 64 bit), Mac (Apple Silicon) and Windows (x86 64 bit) systems. Please use the following URL pattern:
https://dl.photonscore.io/<VERISON>/photonscore-2.8.2-<OS>-py<PYTHON_VERSION>.zip
For example, windows Python module for Python 3.12 is located uder:
https://dl.photonscore.io/2.8.2/photonscore-2.8.2-windows-py3.12.zip
The photonscore module is distributed as a per-platform, per-Python-version package. Install it with pip, pointing either to a downloaded archive or directly to the download URL for your platform and Python version:
pip install https://dl.photonscore.io/py/2.8.1/windows_x64/photonscore-python-2.8.1-windows_x64-py3.11.zipWe recommend using uv python manager:
uv venv --seed --python 3.12 py
uv pip --directory py install jupyterlab bokeh https://dl.photonscore.io/2.8.2/photonscore-2.8.2-mac-py3.12.zipWindows
Download and run the LINTag Capture installer for Windows from the download page. The desktop applications are signed and notarised. Install the photonscore Python package into your environment using the pip command above. The software requires a .NET8 Desktop and ASP Runtimes. Available at no cost from Microsoft .NET website: https://dotnet.microsoft.com/en-us/download/dotnet/8.0.
https://dl.photonscore.io/2.8.2/LINTagCapture-2.8.2-windows.zip
Linux
Install the LINTag Capture application package is not available by default. Please let us know if you would like to have one. Write us a line to email@photonscore.de.
macOS
Install the signed and notarised LINTag Capture application for macOS, then install the photonscore Python package for Apple Silicon. The macOS version has bundled .NET8 Runtime, thus no extra steps are required.
https://dl.photonscore.io/2.8.2/LINTagCapture-2.8.2-mac.zip
4 LINTag Capture — Software Overview
LINTag Capture is the desktop application that drives the device. It connects to the LINTag over the data interface, displays live count rates and histograms, configures the eight input channels, runs the on-line correlator, and writes time-tag streams to disk. The application also exposes a gRPC remote-control service, which is what the photonscore Python module connects to.
The processing engine
At the heart of LINTag Capture is a streaming processing engine that receives the time-tag stream from the device and feeds it to all active consumers — the live histogrammer, the correlator, and the file writer — in parallel. Tags arrive timestamped at 1 ps resolution; the engine routes them without forcing you to choose between viewing data live and recording it.
Main interface areas
Screenshot below depicts main interface of LINTag Capture software.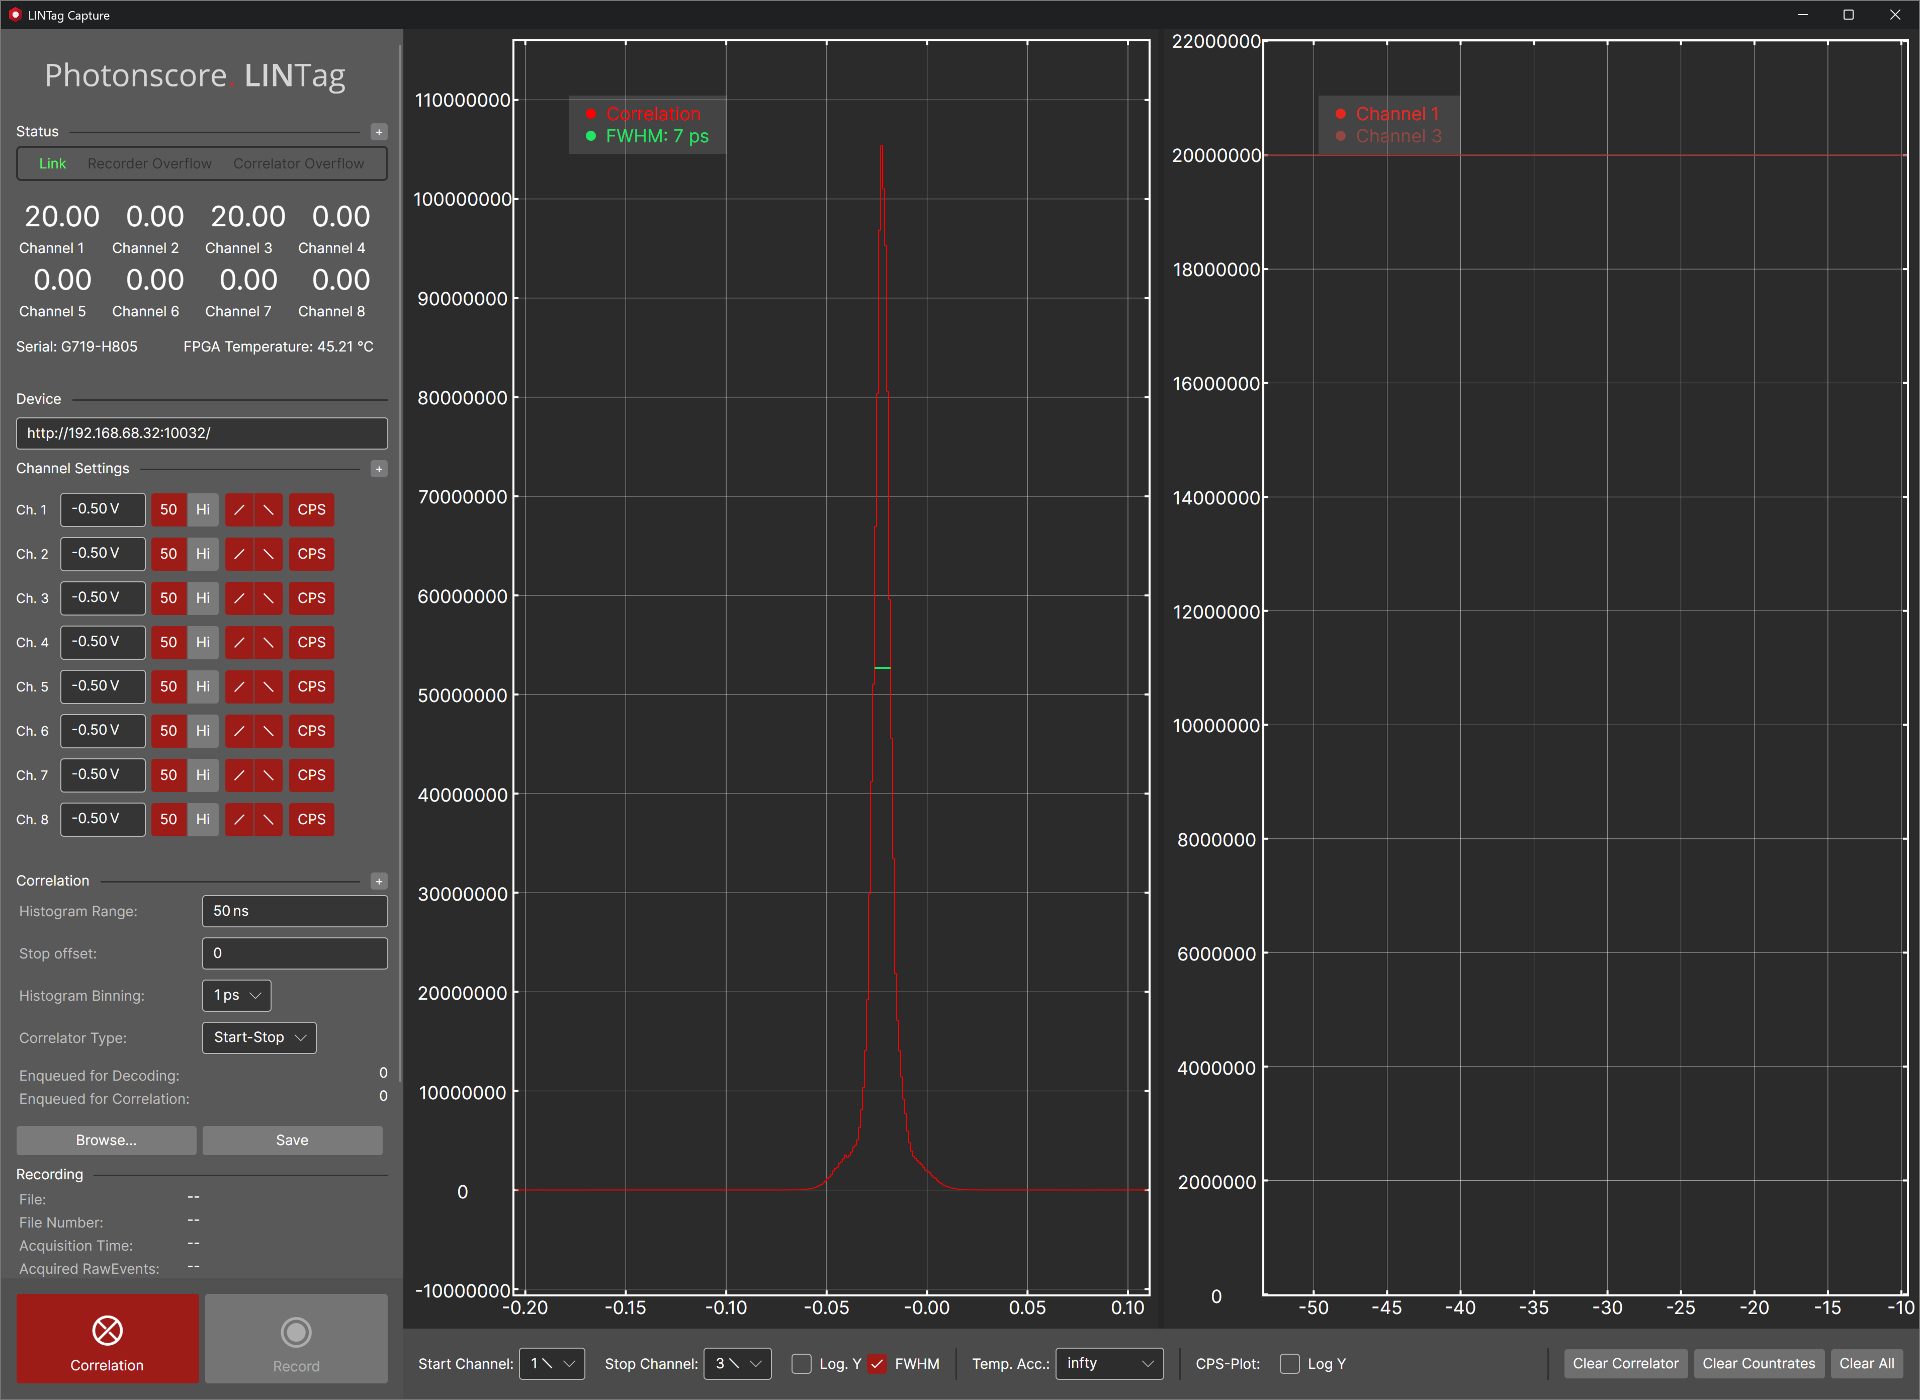
The LINTag Capture window is divided into three display areas with a control strip along the bottom:
Left control panel (“cruise control”) — the master control column for the instrument (see below).
Central correlator plot — the live start–stop correlation histogram between the selected channels. Counts are plotted against delay time; a fitted FWHM marker and its value (e.g. “FWHM: 7 ps”) are overlaid when FWHM display is enabled.
Right CPS panel — a counts-per-second (CPS) plot showing the live count-rate history of the selected channels over time.
Below the plots, a control strip sets how the correlator and plots are displayed: a Start Channel and Stop Channel selector for the correlator, a Log. Y toggle for logarithmic or linear vertical scale, an FWHM checkbox that shows or hides the fitted FWHM value, a Temp. Acc. (temporal accumulation) selector that sets the displayed acquisition period, a CPS-Plot Log Y toggle, and the Clear Correlator, Clear Countrates, and Clear All buttons.
Cruise control
Status
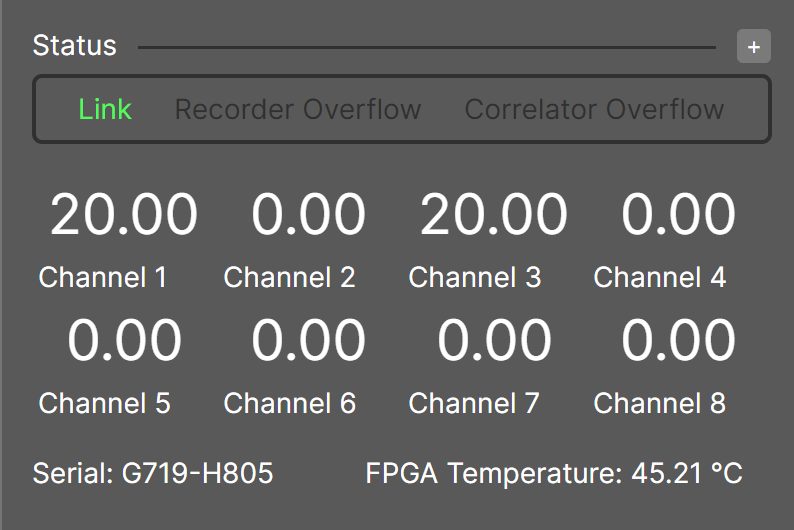
The Status section gives an at-a-glance overview of the device's live state. Along the top, three indicators report the connection and data-path health: Link lights green when LINTag Capture is connected to the device, while Recorder Overflow and Correlator Overflow warn when the file writer or correlator cannot keep up with the incoming tag rate. Below them, eight readouts show the live count rate (CPS) of Channels 1 through 8. The bottom line displays the device Serial number and the current FPGA Temperature in °C. The serial number is useful to distinguish between devices when several are used in parallel.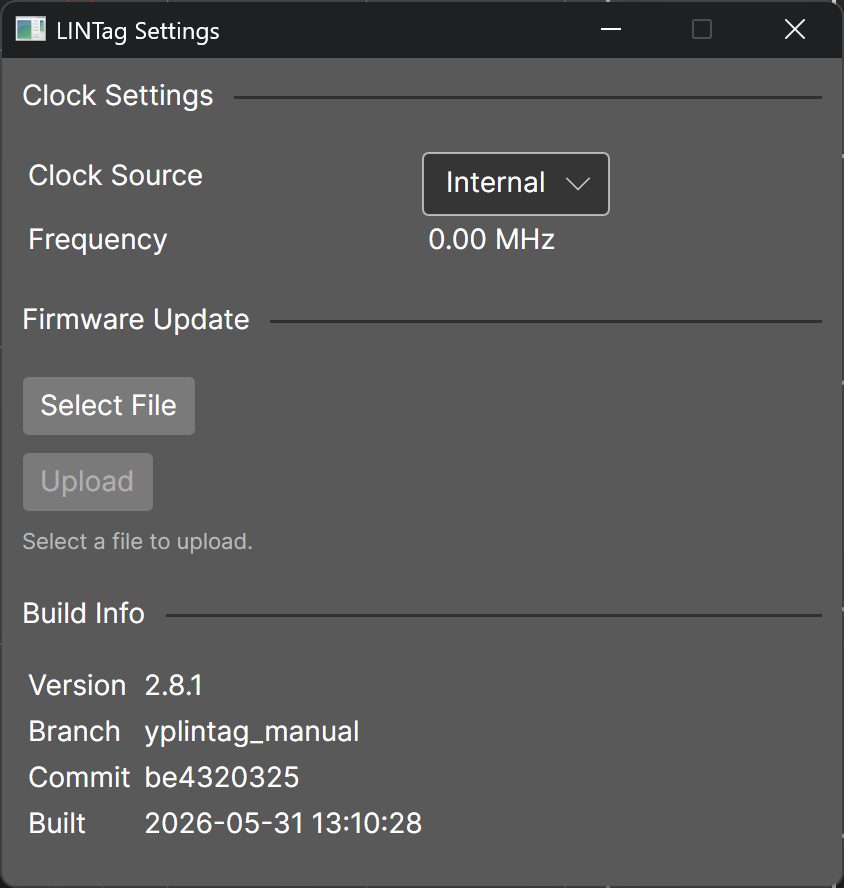
Clicking “+” in the settings section opens the extended LINTag Settings window, which groups three sections. Clock Settings selects the Clock Source (e.g. Internal or External) and shows the current external reference Frequency in MHz. Firmware Update lets you Select File and Upload a firmware image to the device. Build Info reports the running software Version, Branch, Commit, and Built date for support and version tracking.
Device

The Device section holds the address LINTag Capture uses to reach the instrument, entered as a URL combining the device IP address and a port (as shown in the figure). The port selects the protocol used to communicate with the device: port 10031 for HTTP/1 and port 10032 for HTTP/2, the latter being required for the gRPC interface that the photonscore Python module connects to.
Direct data stream is available HTTP/1 protocol under http://a.b.c.d:10031/data.
Channels settings
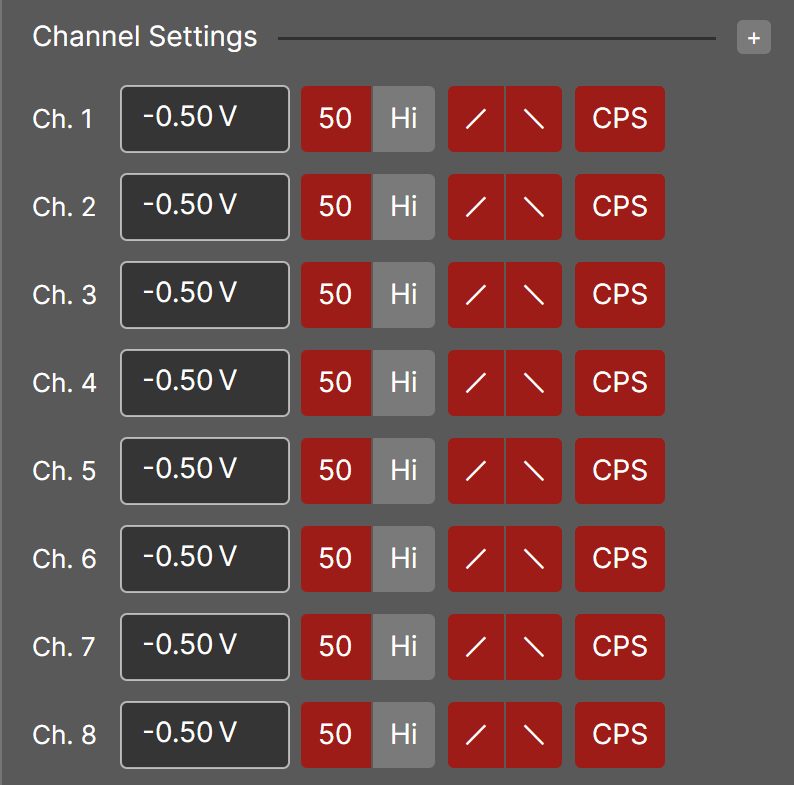
The Channel Settings panel gives one row per input, Ch. 1 through Ch. 8, with the most commonly used controls. For each channel the row shows the discriminator Threshold (e.g. −0.50 V); a Termination toggle selecting 50 Ω or Hi-Z; a pair of edge buttons selecting the rising and/or falling edge to detect; and a CPS button that adds the channel's live count rate to the CPS plot. Click “+” (top right) to open the extended Channel Detail Settings.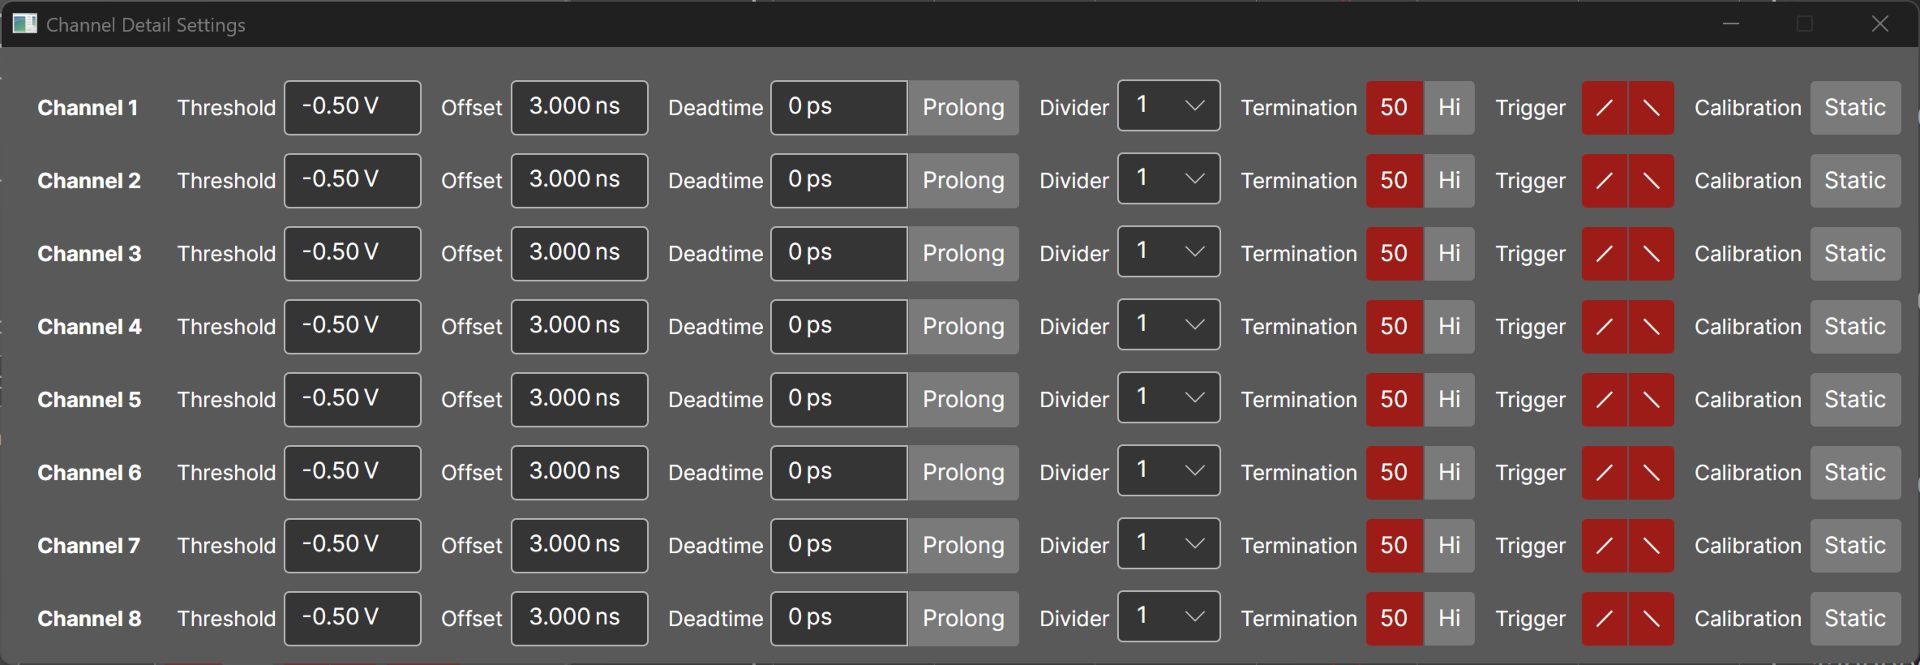
The Channel Detail Settings window exposes the full per-channel configuration for all eight channels. In addition to Threshold and Termination (50 Ω / Hi-Z), each row adds: Offset, a per-channel time offset (e.g. 3.000 ns); Deadtime, an artificial dead time in picoseconds, with a Prolong toggle that extends the dead time for events arriving within it (afterpulse suppression); Divider, which transmits only every Nth event; a Trigger edge selector (rising and/or falling); and a Calibration toggle, where Static fixes the channel calibration.
Correlation
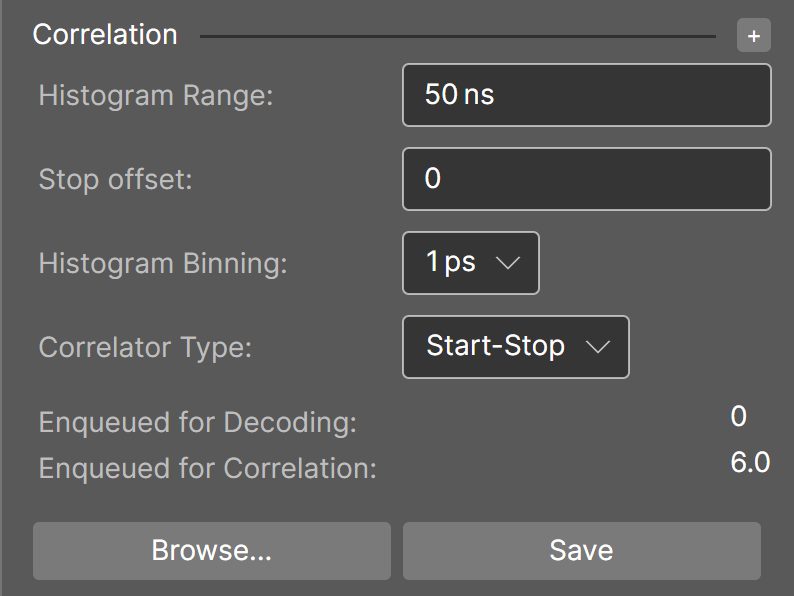
The Correlation panel configures the online correlator. Histogram Range sets the width of the correlation window (e.g. 50 ns). Stop offset applies a time offset, in picoseconds, to the stop signal; this offset affects only the correlation and not the recorded time tags. Histogram Binning selects the bin width (e.g. 1 ps), and Correlator Type selects the mode (Start-Stop or Multi-Start-Stop). Below these, two read-only counters — Enqueued for Decoding and Enqueued for Correlation — report the current processing backlog. Browse… chooses a file name and location, and Save writes the current correlation histogram to that file.
Recording
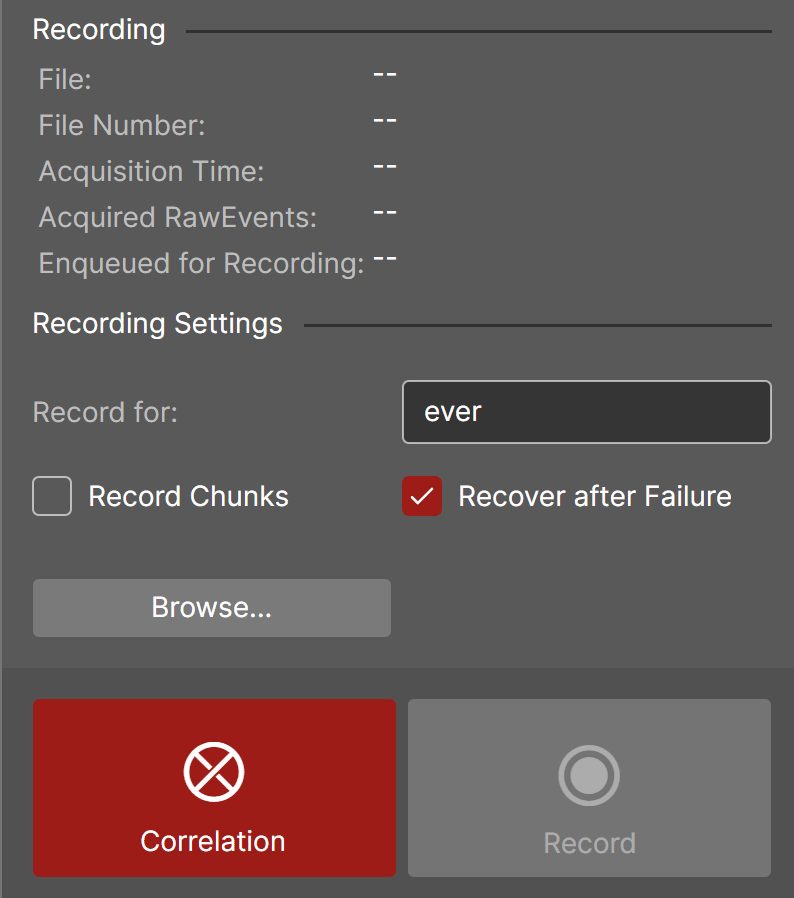
The Recording panel controls writing the time-tag stream to a .photons file and reports the state of the current recording. The status block at the top shows the current File name, File Number, Acquisition Time, the number of Acquired RawEvents, and the count Enqueued for Recording (the backlog still to be written). Under Recording Settings, Record for sets the recording duration, entered in natural time units — for example 30s for 30 seconds, 15m 45s for fifteen minutes and forty-five seconds, or 1h for one hour — or “ever” to record until stopped. Record Chunks splits the recording into separate files; when it is selected, a new file is recreated at each interval given by the Record for period. Recover after Failure resumes recording automatically if the stream is interrupted. Browse… selects the file name and location. At the bottom, the Correlation button starts or stops online correlation, and the Record button starts or stops writing to disk.
5 Hardware
This section describes the physical LINTag instrument: its panels and connectors, signal inputs, clocking, host connectivity, power, and physical dimensions. All electrical and timing values are drawn from the LINTag data sheet.
Front and rear panels
The LINTag is housed in a 3U, 19-inch rack-mountable enclosure measuring 480 × 345 × 133 mm (w × d × h). It can be mounted in a standard rack or operated as a tabletop instrument.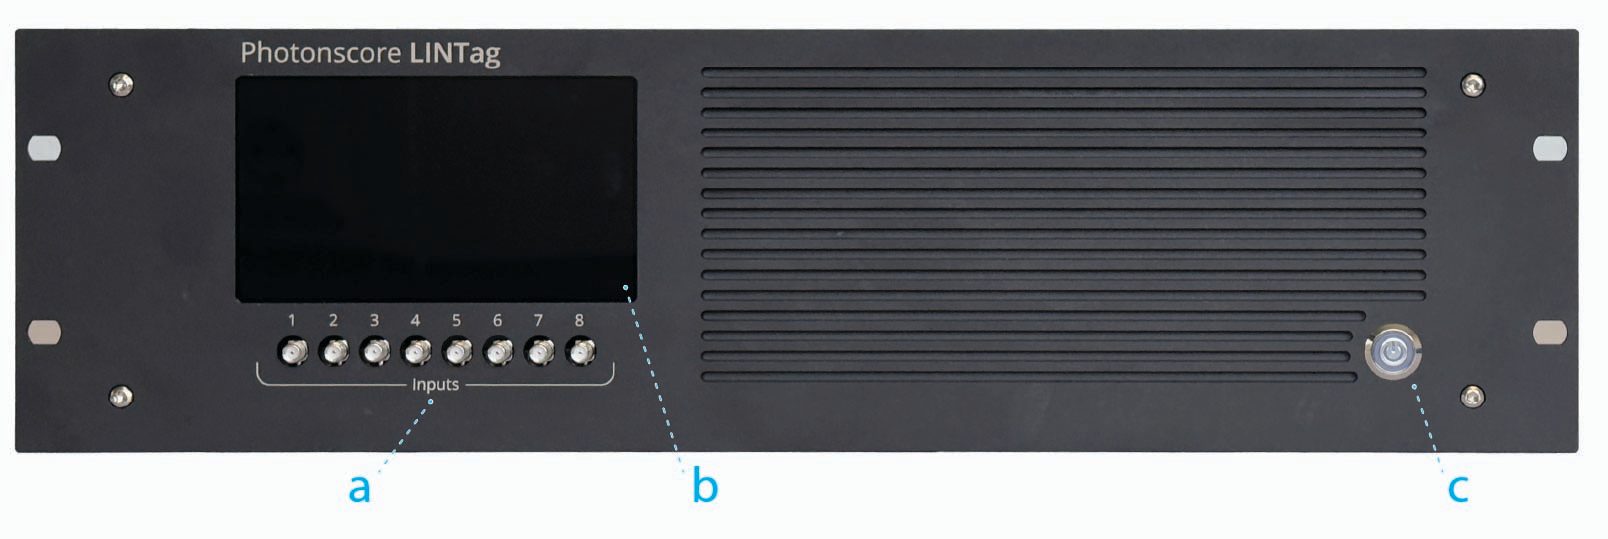
The front panel carries the instrument's signal interface and local controls:
(a) SMA input signal connectors — the eight acquisition channel inputs, numbered 0 to 7 in software. Each accepts a coaxial SMA connection and is independently configured for threshold (-2V to +2.5V) and impedance (50 Ω or Hi-Z). The acquired signal edges are configured from LINTag Capture or the Python API.
(b) Touchscreen display — the embedded software interface, used to set the device IP address, adjust screen brightness, and read version information without a host computer attached.
(c) Main power button — switches the instrument on and off. The unit is powered from the external 24 V supply connected at the rear panel.
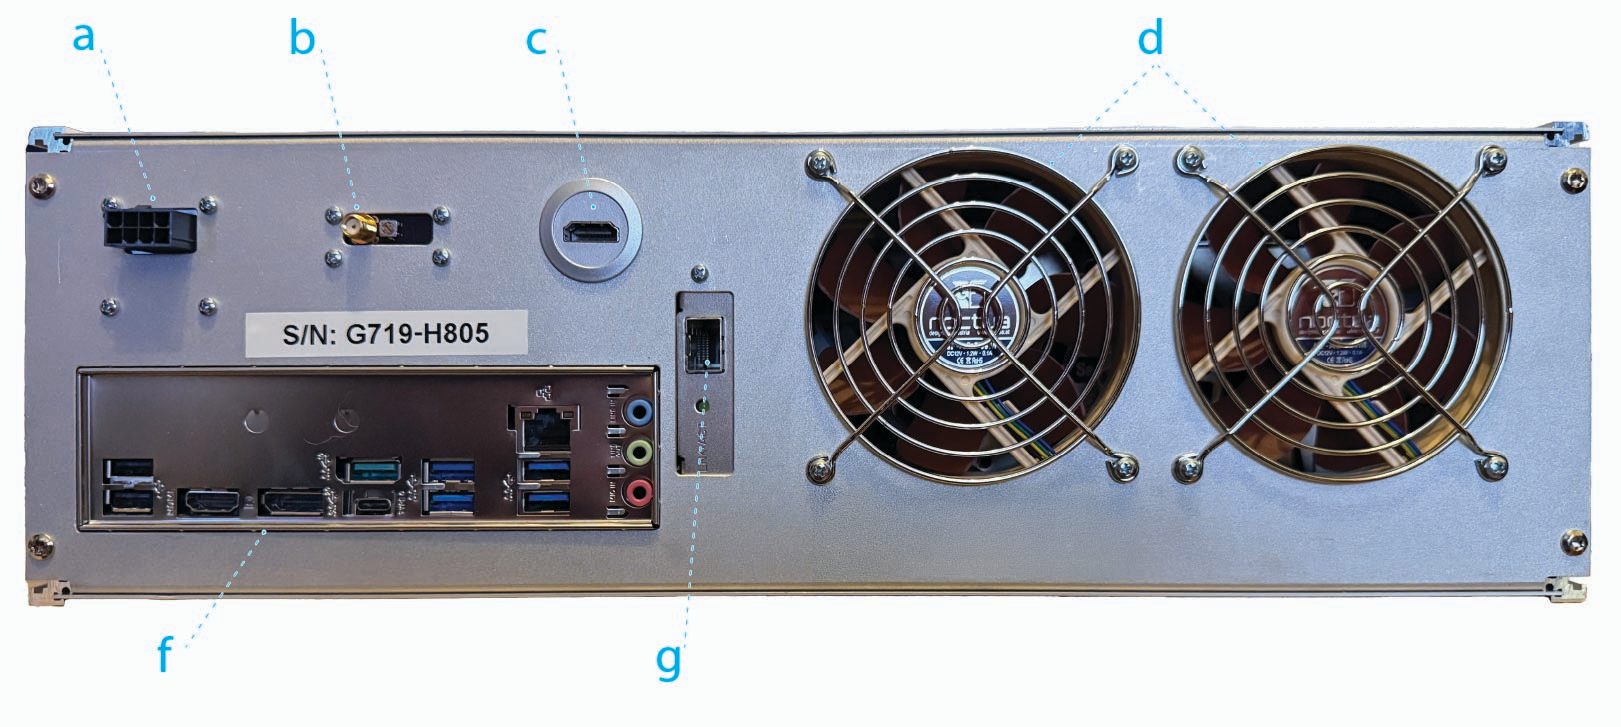
The rear panel carries power, clocking, host connectivity, and the embedded-PC interface:
(a) Main power connector — accepts the external 24 V / 12.5 A supply. Do not disconnect the supply from the LINTag while it remains connected to wall power.
(b) External clock input — feeds an external clock reference. A 10 MHz or 50 MHz reference can be applied here and selected at runtime from LINTag Capture; use it to share a common time base with other instruments. Positive, negative or bipolar signals are accepted.
(c) HDMI input of the touchscreen display — drives the front-panel touchscreen that runs the embedded software interface.
(d) System fans — provide forced-air cooling for the enclosure. Keep the airflow path clear when rack-mounting or operating on a bench.
(f) Panel of the embedded PC — the I/O panel of the on-board Intel 13th Gen Core i7 computer, which runs on-device processing and accesses time tags directly from the FPGA for low-latency operation.
(g) SFP+ socket — the 10G Ethernet data link that streams time tags to the host over a HTTP protocol. Fit the SFP+ transceiver supplied with your order (copper or fibre).
Embedded software interface
This section gives an overview of operating embedded software.
Home
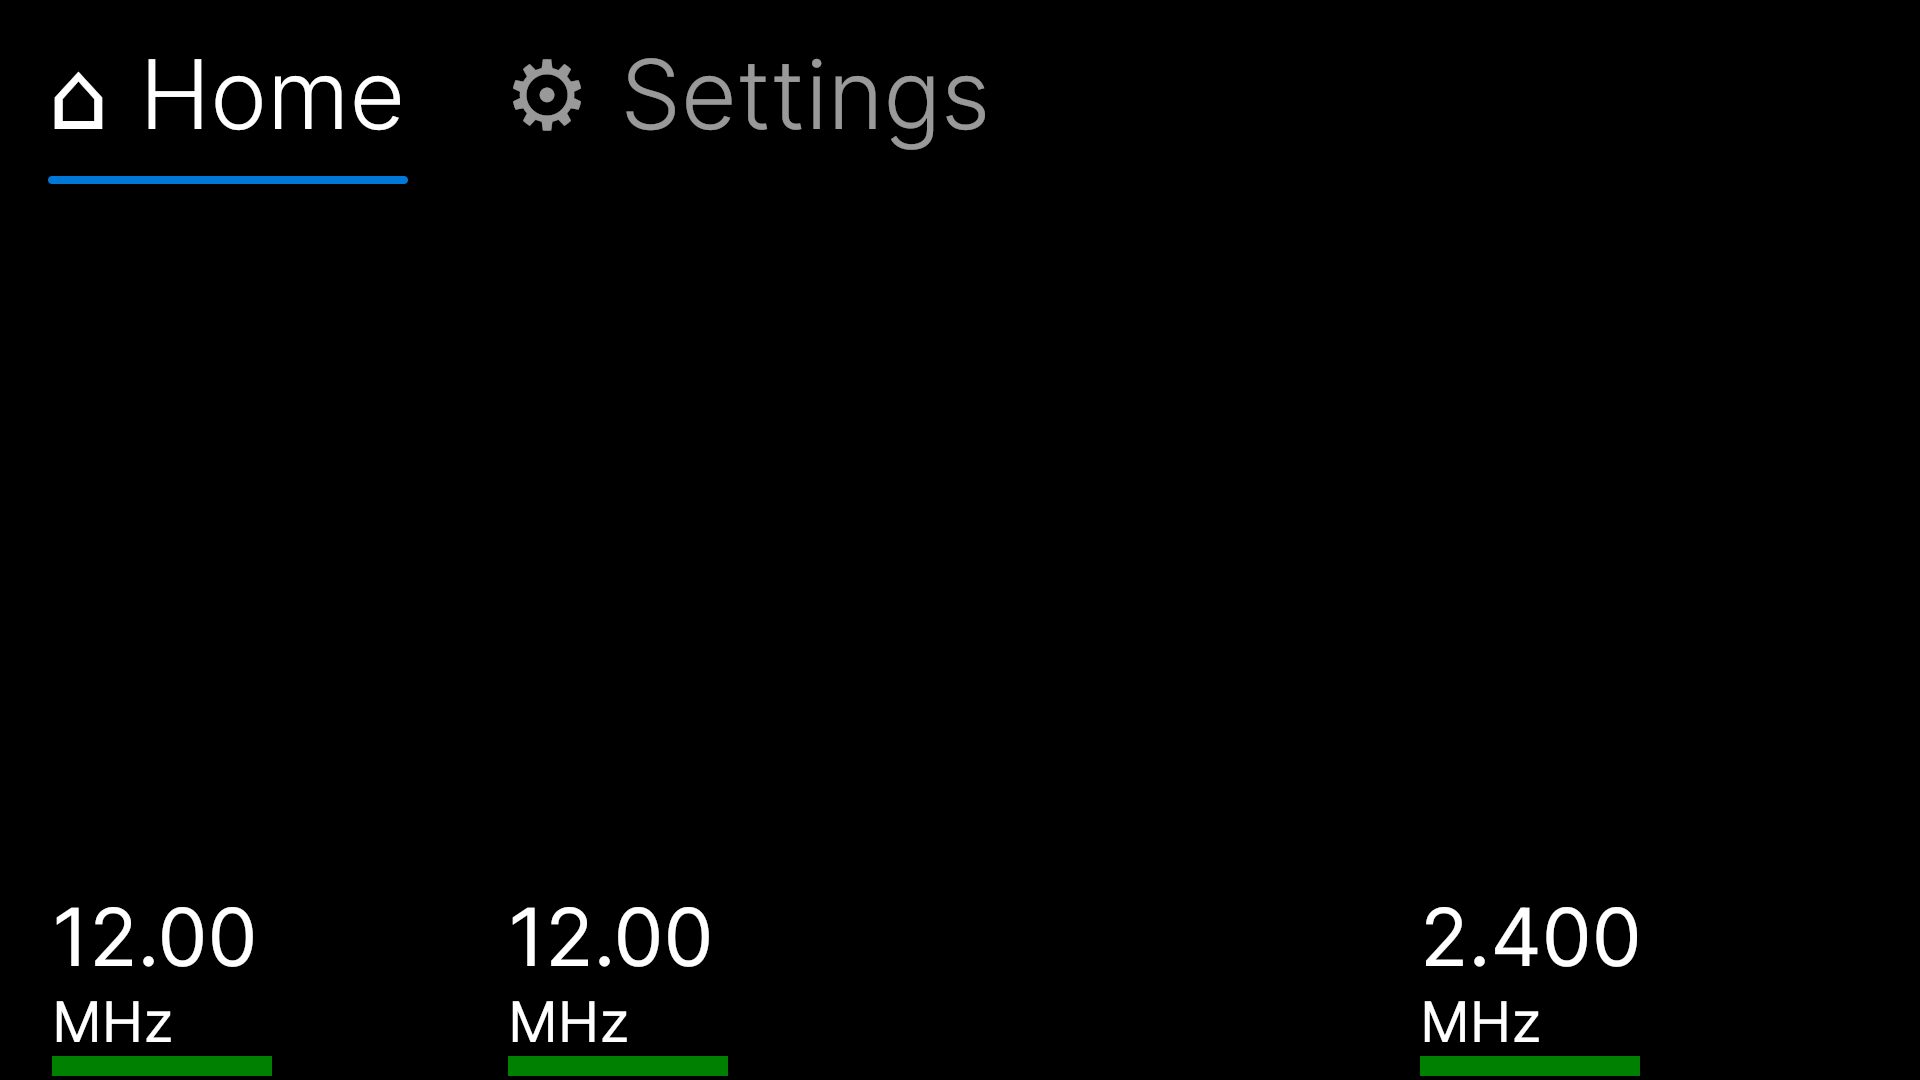
The Home screen is the default view of the embedded touchscreen interface. A tab bar across the top switches between Home and Settings, with the active tab underlined. The body of the screen shows the live count rate of each channel as a large numeric readout in MHz, with a green activity bar beneath each value that fills in proportion to the rate — giving an at-a-glance indication of which inputs are receiving signal without a host computer attached. Tap Settings to access the IP address, screen brightness, and version-information screens described below.
Network
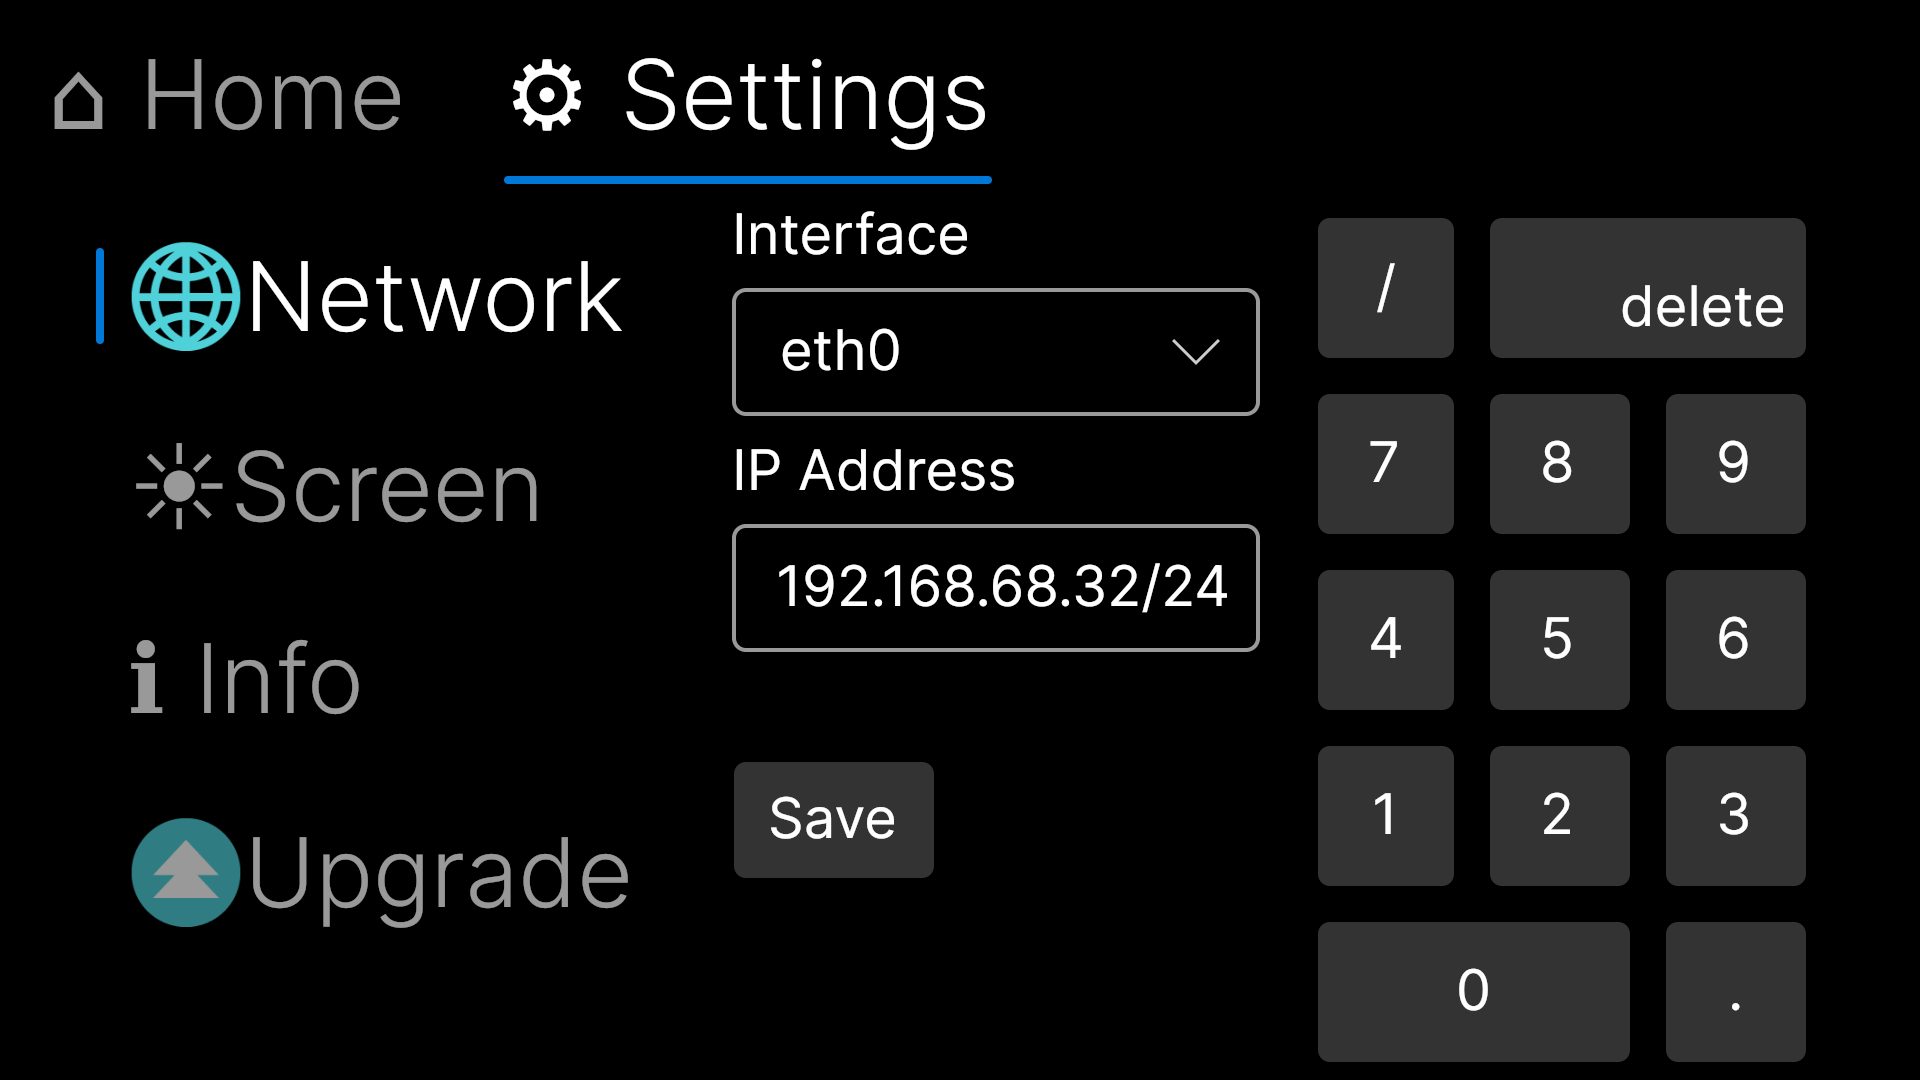
The Network screen, reached from the Settings tab, assigns the device's network address. The left-hand menu lists the settings categories — Network, Screen, Info, and Upgrade — with Network selected here. Choose the network Interface from the dropdown (e.g. eth0), then enter the IP Address in CIDR notation, combining the address and subnet prefix length (for example 192.168.68.32/24). Use the on-screen keypad to type the value; the / key separates the address from the prefix, the “.” key separates the octets, and delete clears the last character. Tap Save to apply the address — it takes a few seconds to take effect. The address must be on the same subnet as the host PC for LINTag Capture to reach the device.
Screen
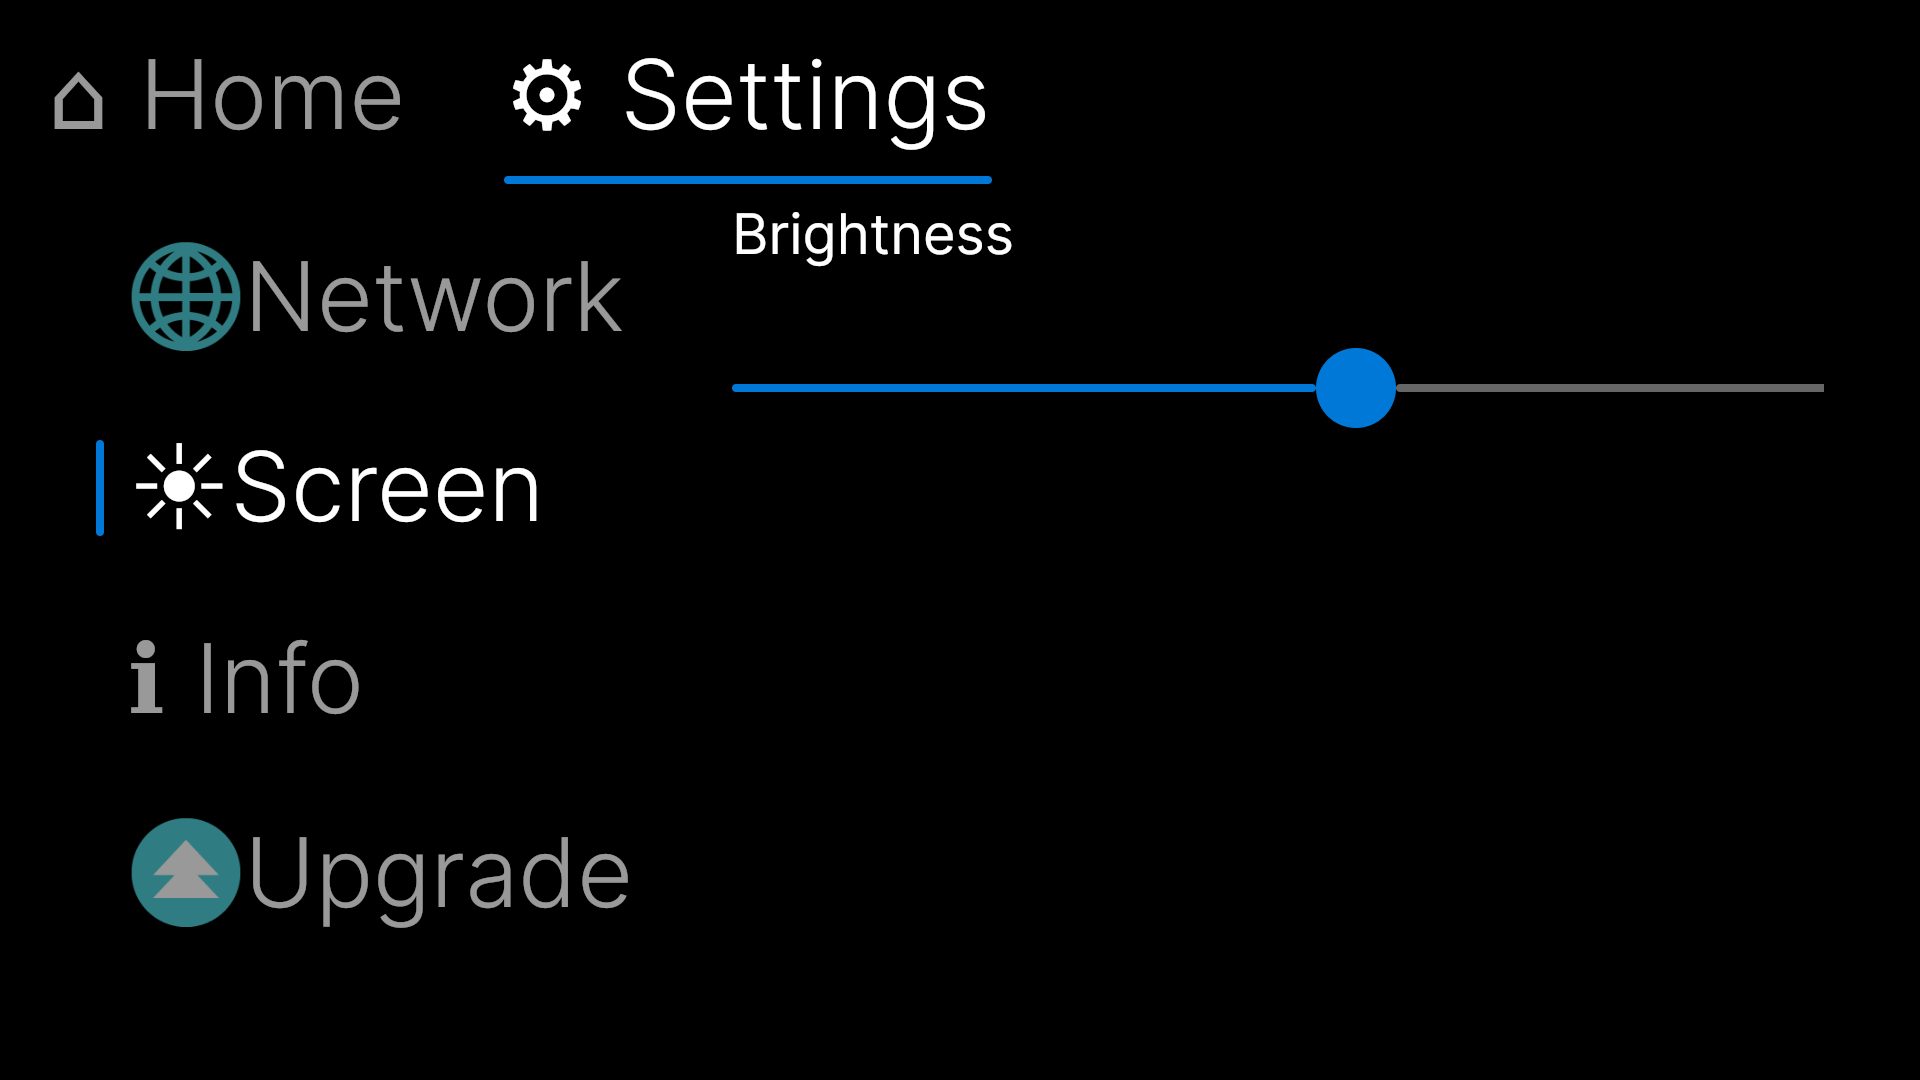
The Screen settings page adjusts the embedded touchscreen display. A single Brightness slider sets the backlight level; drag it left to dim the display or right to brighten it. The change takes effect immediately.
Device information screen
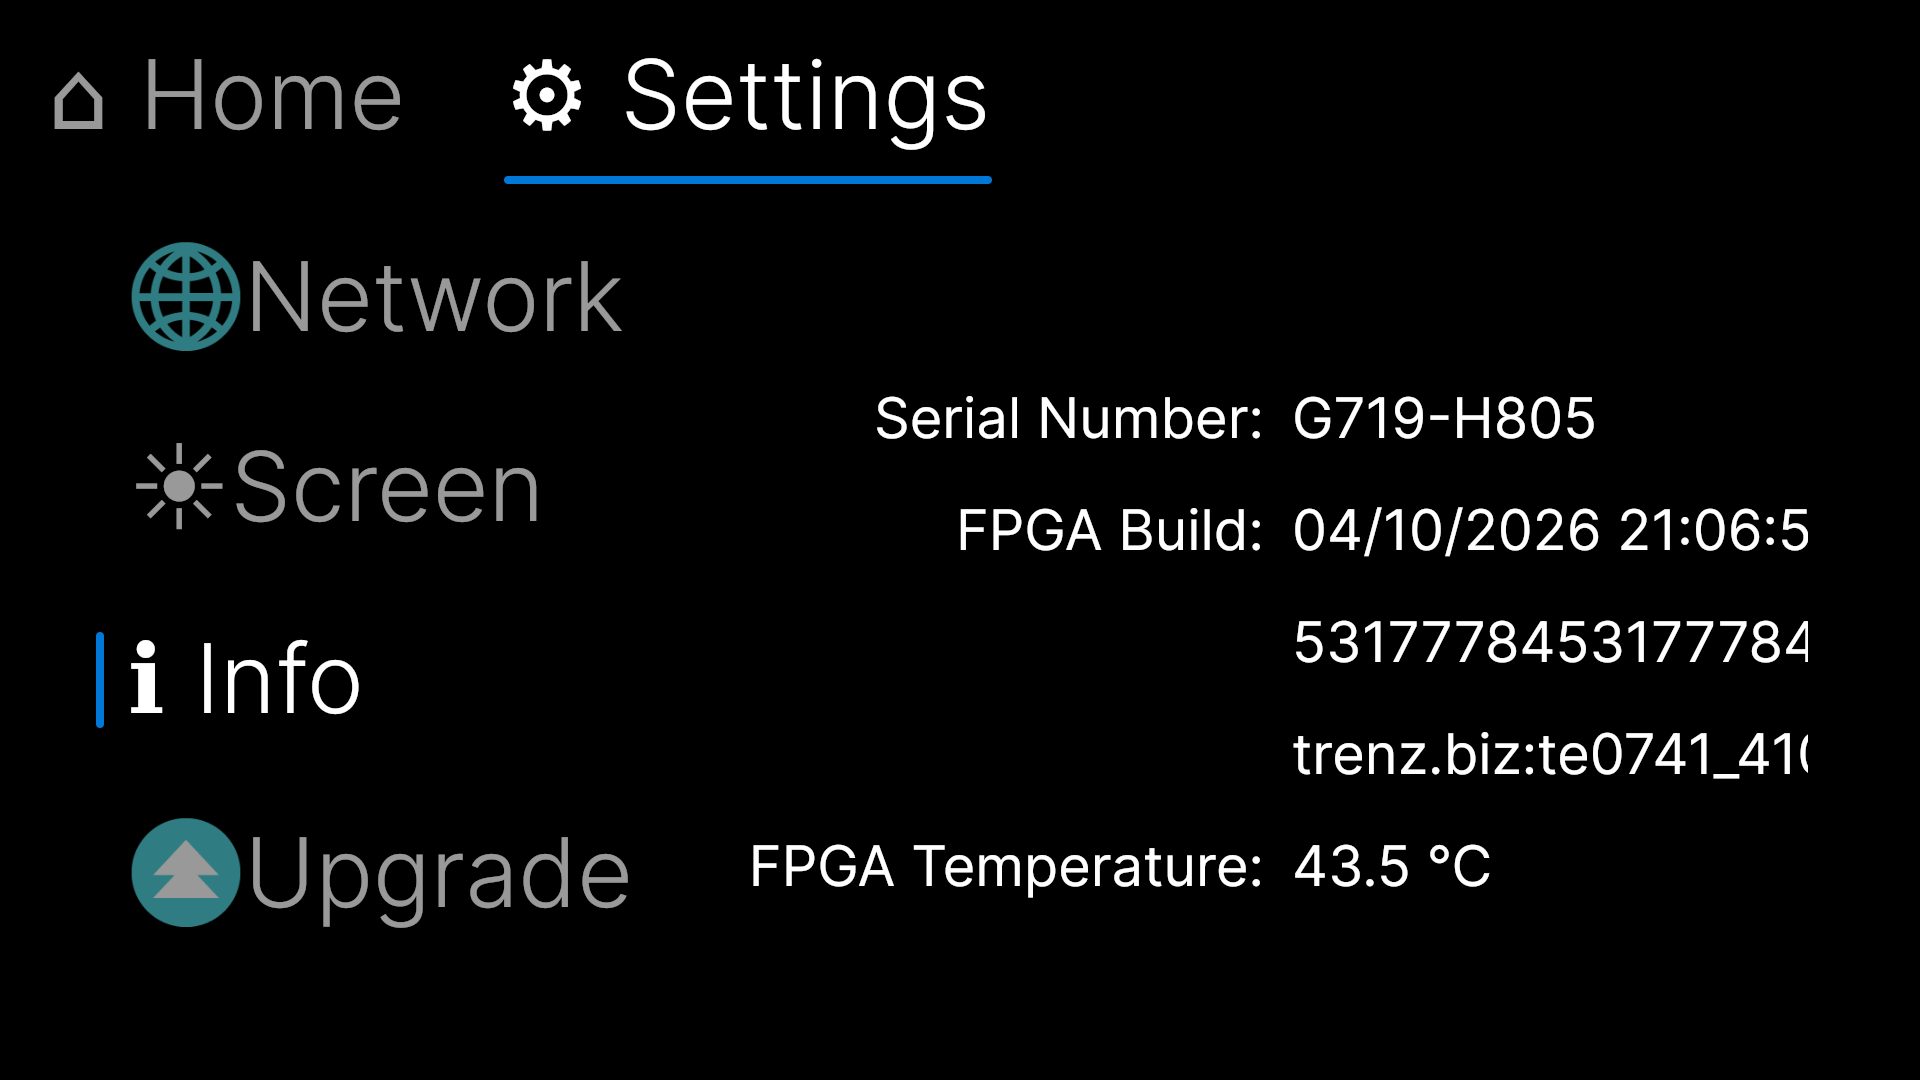
The Info screen reports read-only device identification and status. It lists the Serial Number (e.g. G719-H805); the FPGA Build, giving the build date and time and the firmware build identifier; the hardware module identifier (trenz.biz:te0741…); and the live FPGA Temperature in °C. Use these values when requesting support or when confirming the installed firmware version.
Firmware upgrade
a |
b |
|---|---|
c |
d |
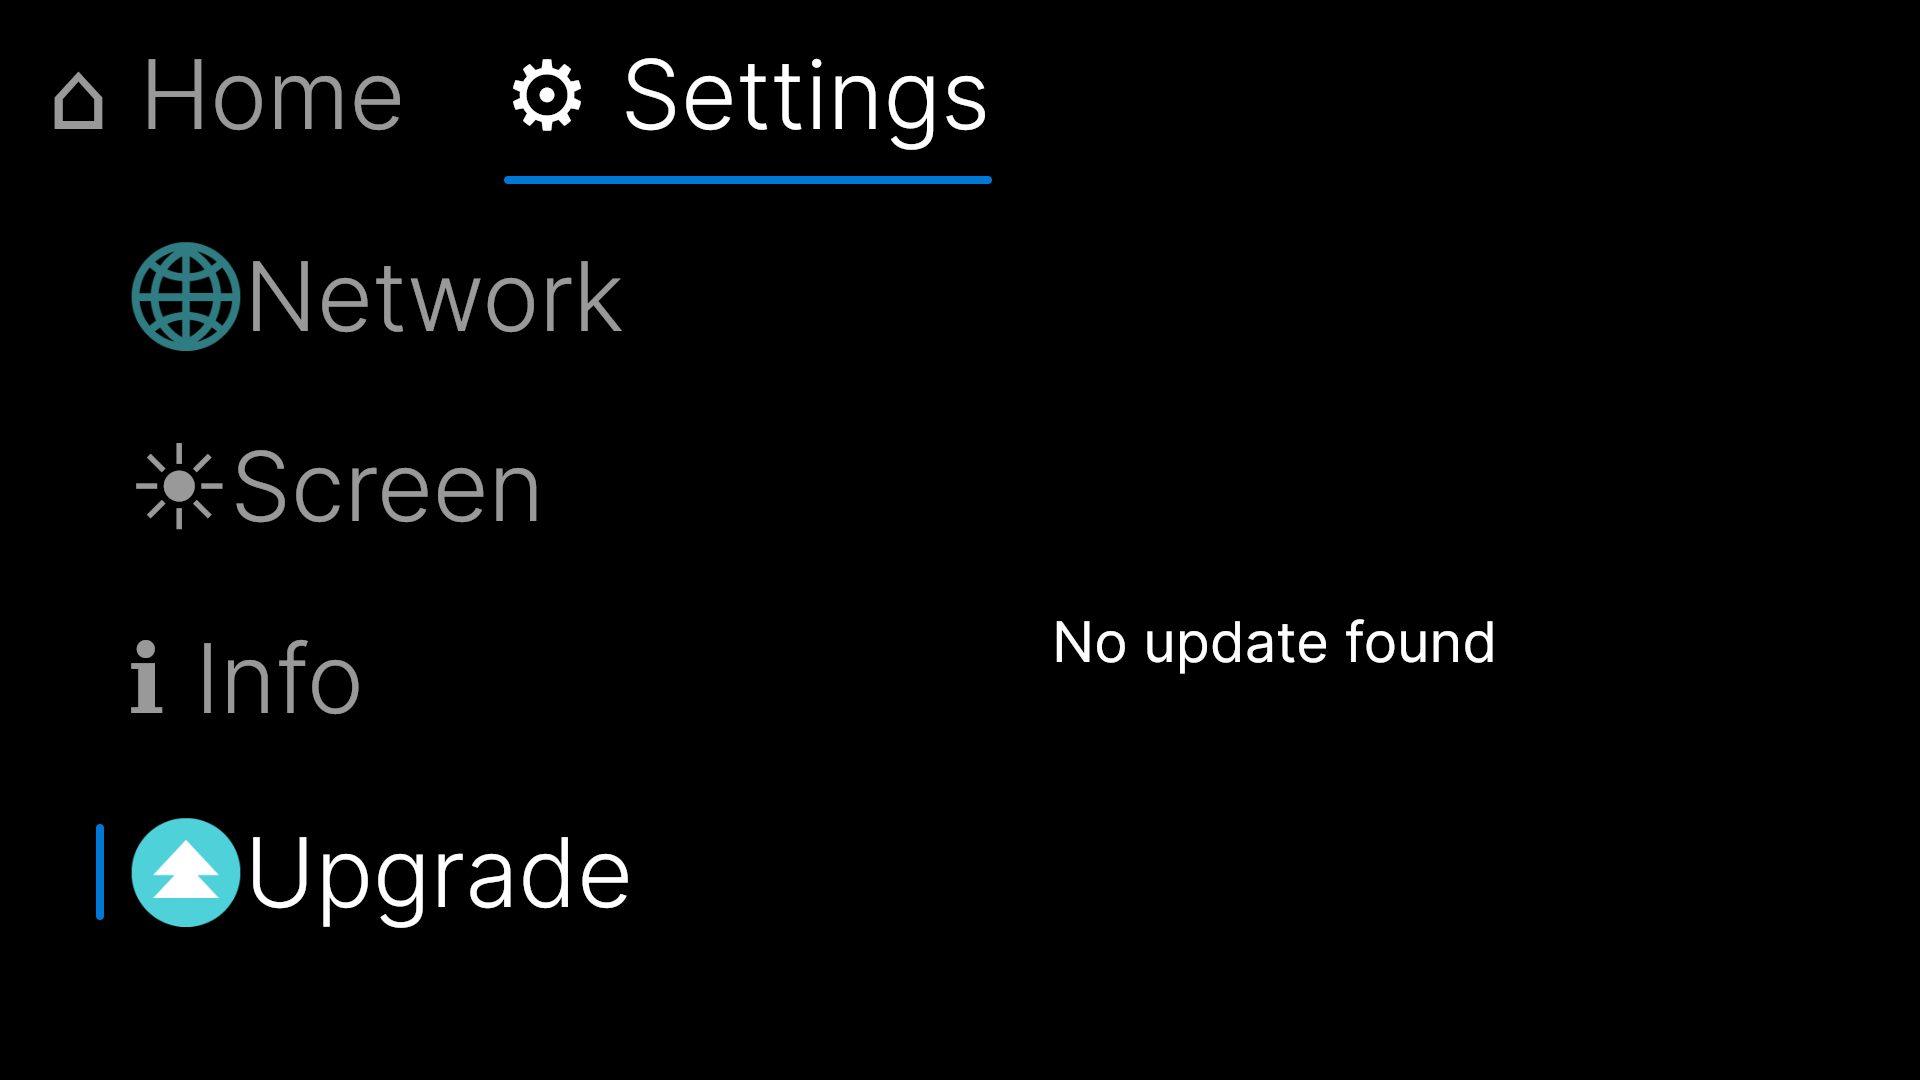
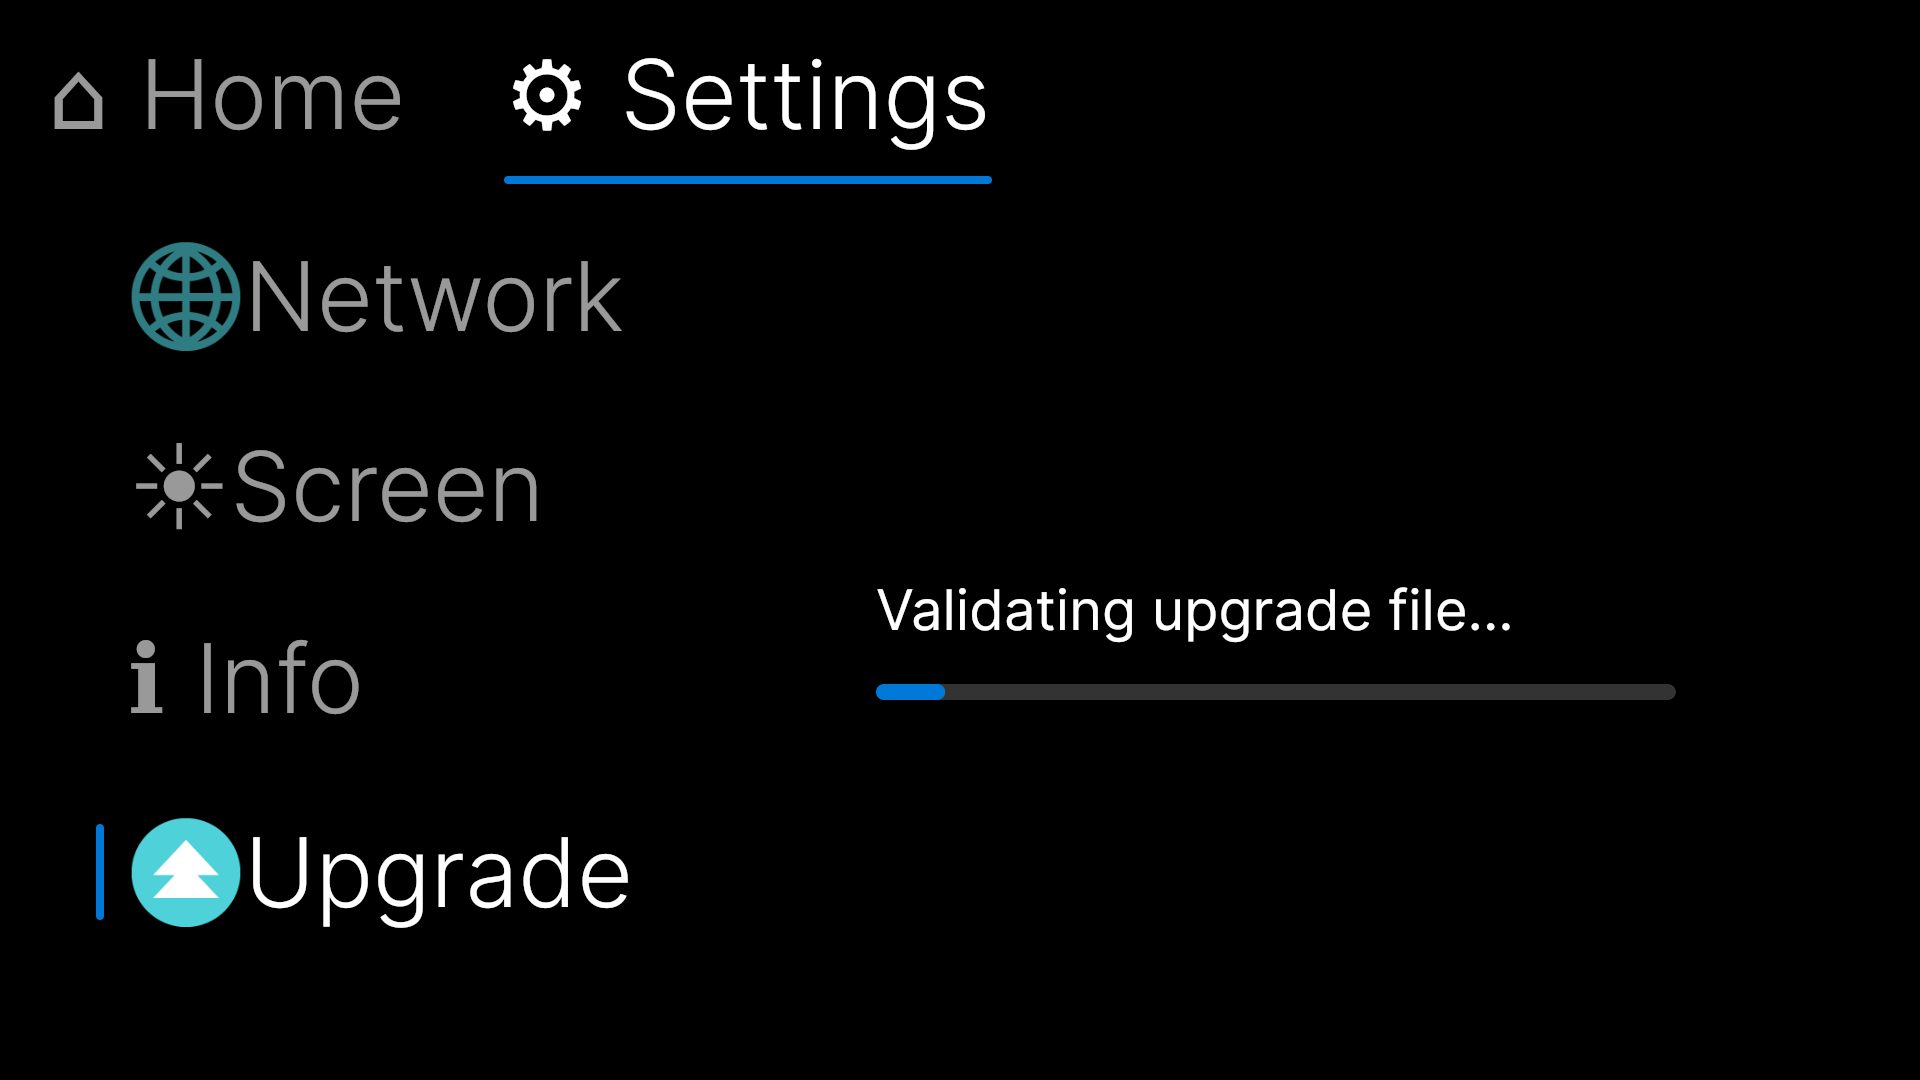
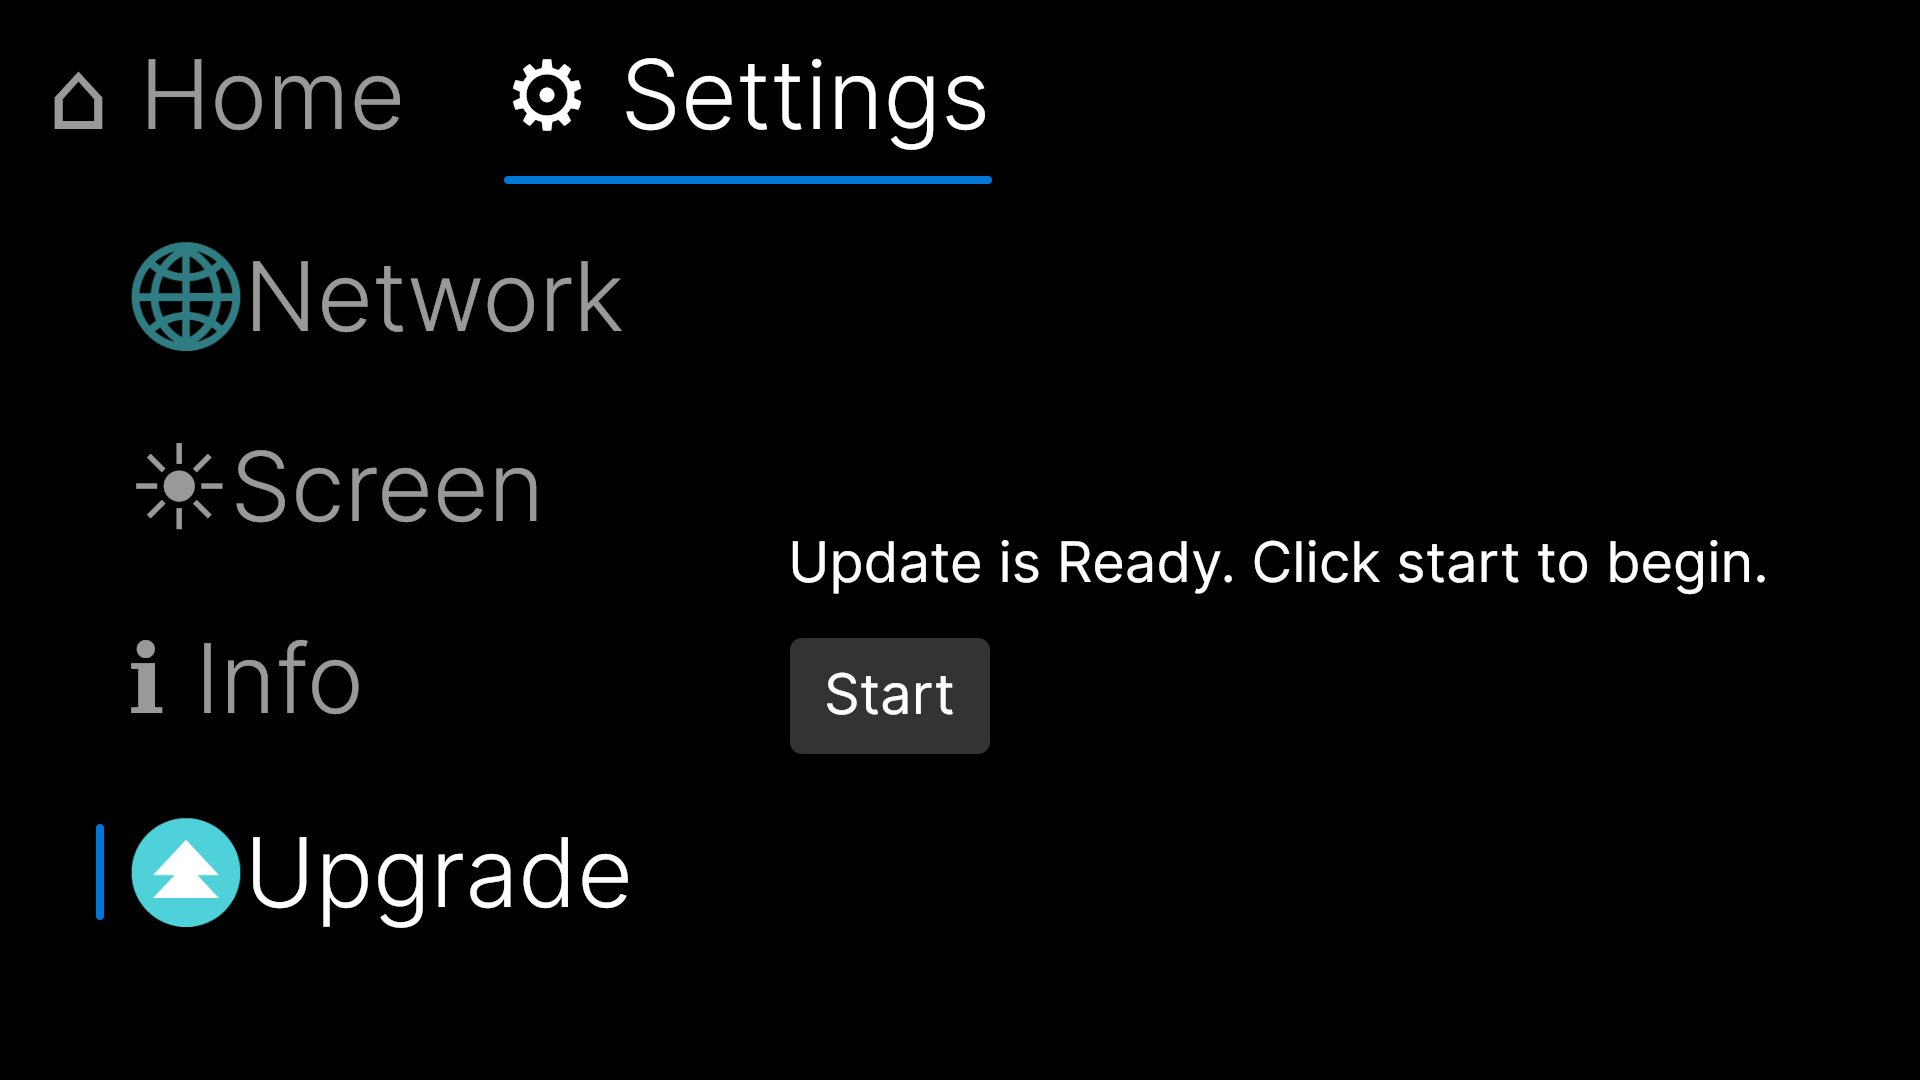
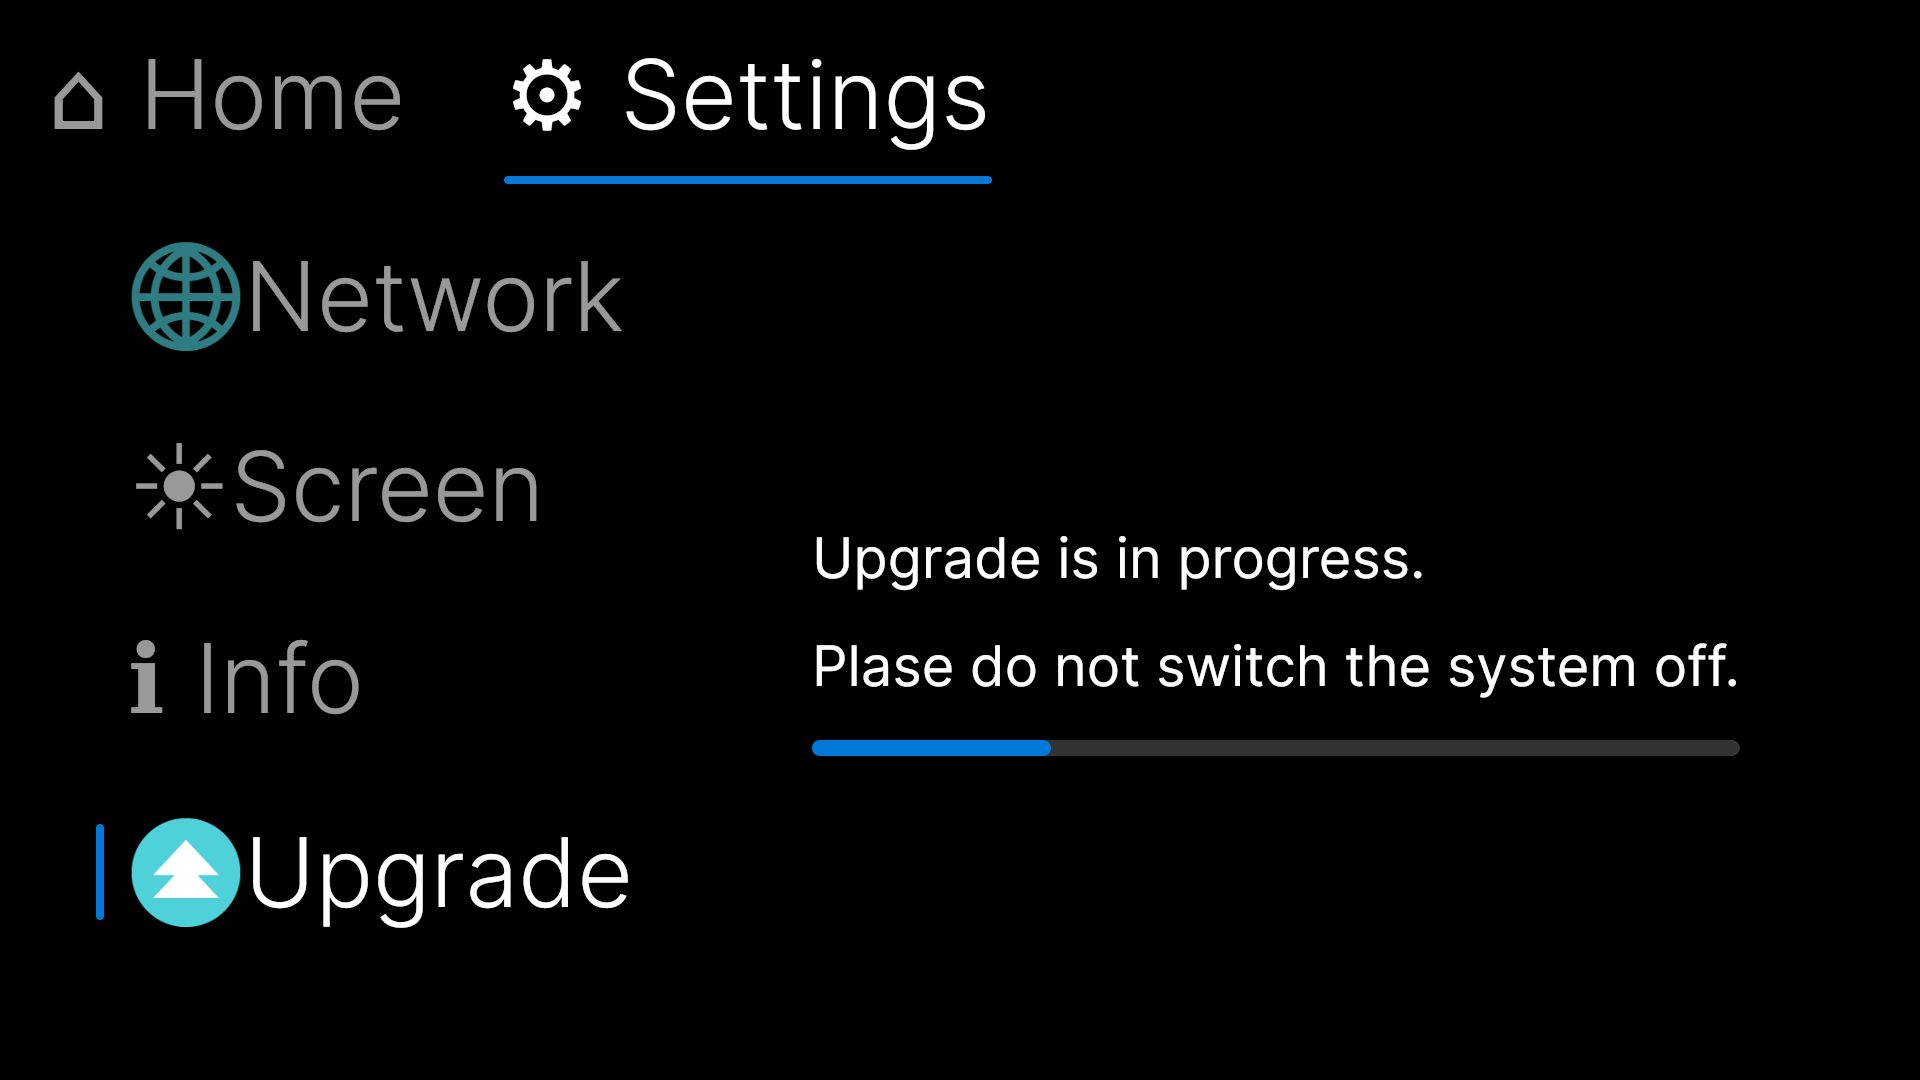
Firmware is upgraded from LINTag Capture and monitored on the embedded touchscreen. First, in LINTag Capture, click “+” in the Status section of the cruise control, select the upgrade file, and click Upload. Then, on the embedded touchscreen, go to Settings → Upgrade to follow progress through four states:
(a) Before a file is uploaded, the screen shows “No update found.”
(b) Once a file has been uploaded, the device validates it — “Validating upgrade file…” — to confirm it is not damaged.
(c) When validation succeeds, the screen shows “Update is Ready. Click start to begin.” Tap Start to apply the firmware.
(d) The upgrade then runs, showing “Upgrade is in progress.” Do not switch the system off while this message is displayed.
Signal inputs
The LINTag provides eight acquisition channels, numbered 0 to 7 in software. Each channel has an independently adjustable input threshold and selectable input impedance, so the instrument can accept signals from a wide range of detectors and logic families without external conditioning.
| Parameter | Value |
|---|---|
| Acquisition channels | 8 (numbered 0–7 in software) |
| Signal level | −2 to 2.5 V |
| Input impedance | 50 Ω / Hi-Z, selectable per channel |
| Polarity | Negative / positive, selectable per channel |
| Edge detection | Rising and/or falling, selectable per channel |
| Threshold | Adjustable per channel (−2.0 to +2.5 V) |
Reference clock
The LINTag can be operated from its internal reference or locked to an external clock. The external clock input accepts a 10 MHz reference a 50 MHz external reference is also supported and can be selected at runtime from LINTag Capture. Use an external reference when you need to synchronise the LINTag with other instruments or with a laboratory frequency standard.
Host connectivity
Time tags reach the host computer over a 10G Ethernet SFP+ connection that runs a full-stack TCP/IP interface. USB 3.0 and Thunderbolt 3 are also provided. For latency-critical applications, the embedded PC can access time tags directly from the FPGA, avoiding the round trip to an external host.
The instrument carries an embedded Intel 13th Gen Core i7 processor, allowing measurements and analysis to run on the device itself.
Power
The LINTag is powered from an external 24V supply rated at 12.5A.
6 Python API and Library Reference
The LINTag is controlled from Python through the photonscore module, conventionally imported as pe. The module communicates with a running LINTag Capture application over a gRPC connection; it does not talk to the hardware directly. Start LINTag Capture before running any of the examples in this manual.
LINTagRemote module
The LINTagRemote module provides a lightweight gRPC client that controls the LINTag Capture desktop application running on a networked host. Through it you configure the eight input channels, read back live count rates, and start or stop recordings of tagged events to a file on the device.
The settings-diff model
Communication follows a settings diff pattern. Configuration changes are not sent immediately; instead they are staged locally in a buffer (new_settings). A single call to sync() pushes the accumulated diff to the device and, in the same round trip, refreshes the read-only status fields (such as the per-channel count rates) into read_settings. This keeps network traffic to one request per batch of edits.
- Stage changes with
setup_channel(...)— buffered, not sent. - Commit and refresh with
sync()— one RPC; resets the staging buffer afterward. - Poll device state by calling
sync()with nothing staged — harmless and cheap.
Key characteristics
- Fixed channel grid of 8 channels (indices 0–7).
- The constructor does not sync automatically — read-only fields such as cps stay empty until the first
sync(). - gRPC send/receive message limits are raised to 1 GiB to accommodate large settings/state payloads.
Quick Start
Configure two channels, record for a minute, and read the live count rate:
from photonscore.LINTag.LINTagRemote import LINTagRemote

tag = LINTagRemote("192.168.1.10:50052")
tag.setup_channel(0, threshold=-0.5, rising_edge=True)
tag.setup_channel(1, threshold=-0.5, rising_edge=True)
tag.sync()                  # apply config, read back device state
print(tag.cps)              # live count rate per channel (8 values)

tag.start_recording("run.lt", chunk_seconds=60)
# ... acquisition runs on the device ...
tag.stop_recording()Note that start_recording() calls sync() internally, so any channel changes staged beforehand are committed together with the recording command.
Class: LINTagRemote
Remote control handle for a LINTag time tagger. Wraps the gRPC LINTagRemote service exposed by the LINTag Capture application. Configuration changes are staged locally in new_settings; call sync() to commit them and read the current device state back into read_settings.
Attributes
| Attribute | Type | Description |
|---|---|---|
| grpc_target | str | Resolved host:port of the gRPC server. |
| grpc_channel | grpc.Channel | Underlying insecure gRPC channel. Send/receive message limits raised to 1 GiB. |
| grpc_client | LINTagRemoteStub | Generated gRPC stub used for RPCs. |
| new_settings | LINTagRemoteSettings | Buffer of changes staged but not yet sent to the device. |
| read_settings | LINTagRemoteSettings | Device state returned by the most recent sync(). |
Methods
__init__(target=None)
Connect to the LINTag Capture gRPC server. Sets up the insecure channel (with 1 GiB message limits) and the staging/read buffers. Does not perform a sync.
Parameters
| Name | Type | Description |
|---|---|---|
| target | str, optional | Host and port of the gRPC server, e.g. "192.168.1.10:50052". Defaults to "localhost:50052". |
sync()
Push pending settings to the device and refresh all status fields. Sends the accumulated new_settings diff via the Sync RPC. The server returns the full current device state, which is stored in read_settings. Afterward new_settings is reset, so the next sync() only sends newly staged changes.
Calling this with nothing staged is a harmless way to poll the current device state (e.g. to refresh cps).
cps (property)
Returns a numpy.ndarray of the per-channel count rate in Hz — one entry per channel (8 values). Reflects the device state from the most recent sync(); call sync() first to refresh it.
setup_channel(channel, ...)
Stage configuration changes for a single input channel. Only parameters passed as non-None are written; the rest are left untouched on the device. Changes are buffered and take effect on the next sync().
Parameters
| Name | Type | Description |
|---|---|---|
| channel | int | Channel index to configure (0–7). |
| threshold | float, optional | Discriminator threshold, in volts. |
| offset_ns | float, optional | Per-channel timing offset applied to timestamps, in nanoseconds. |
| dead_time_ps | int, optional | Dead time after a detected edge during which further edges are ignored, in picoseconds. |
| prolonged_dead_time | bool, optional | If True, dead time is extended for events detected during the dead time (suppresses afterpulsing). |
| divider | int, optional | Hardware prescaler; only every n-th event is recorded. |
| temrinate_50_ohm | bool, optional | Terminate the channel input with 50 Ω (False leaves it high impedance). The name matches the proto field spelling. |
| rising_edge | bool, optional | Track and record the rising edge. |
| falling_edge | bool, optional | Track and record the falling edge. |
| static_calibration | bool, optional | If True, fix the channel calibration. Needed for signals correlated with the LINTag clock. |
Note: the parameter temrinate_50_ohm is spelled as in the source (and the underlying proto field), retaining the original typo for field-name compatibility.
start_recording(filename, chunk_seconds=None)
Start recording tagged events to a file on the device. Sets the device output path and (optionally) the chunk duration, then immediately calls sync() to apply the change. Any channel changes staged beforehand are committed in the same call.
Parameters
| Name | Type | Description |
|---|---|---|
| filename | str | Destination file path on the device. An empty string stops recording. |
| chunk_seconds | int, optional | Split the recording into a new file every chunk_seconds seconds. If omitted, the device default is used. |
stop_recording()
Stop the current recording. Convenience wrapper that calls start_recording("") with an empty path, signaling the device to close the output file.
Typical Workflow
- Create the handle:
tag = LINTagRemote("host:port"). - Stage per-channel configuration with one or more
setup_channel(...)calls. - Commit and read back device state with
sync(). - Inspect live count rates via
tag.cps. - Begin acquisition with
start_recording(path, chunk_seconds=...). - End acquisition with
stop_recording().
Practical notes
- Always
sync()(directly or viastart_recording) before reading cps — the value is empty before the first sync. - Batch multiple
setup_channeledits, then a singlesync(), to minimize round trips. - File paths in
start_recordingare resolved on the device, not the client machine. - Set
static_calibration=Truefor channels carrying signals correlated with the LINTag clock.
10 Measurement Workflows
This section ties the API building blocks together into complete measurement procedures. The pattern is always the same: connect to LINTag Capture, configure the channels involved, configure and start the measurement, then read or record the results.
11 In-Depth Guides
This section collects topics that go beyond routine configuration: how to clock the instrument from an external reference, and how to achieve the lowest possible latency for feedback experiments.
Reference clock sources
The LINTag can derive its time base from its internal oscillator or from an external reference. Three clock sources are supported and can be switched at runtime from LINTag Capture: the internal clock, an external 10 MHz reference, and an external 50 MHz reference. An IRIG-B input is also available for time-of-day synchronisation.
Use an external reference when the LINTag must share a common time base with other instruments, or when the timing stability of the internal oscillator is insufficient for your measurement. After switching the clock source, allow the instrument to re-lock before relying on its timestamps.
Low-latency operation with the embedded PC
For feedback experiments that cannot tolerate the round-trip latency of streaming time tags to an external host, the LINTag’s embedded PC — built around an Intel 13th Gen Core i7 — can access time tags directly from the FPGA. Running your processing on the embedded PC removes the network and host-bus hops from the critical path.
12 Troubleshooting
This section lists common problems and their likely causes. If a problem persists after the checks below, contact Photonscore support (see Section 14).
The device handle cannot connect
pe.LINTag() communicates with a running LINTag Capture instance over gRPC. If the connection fails, confirm that LINTag Capture is running, that it is listening on the expected port (5556 by default), and — for a remote connection — that the host address and any firewall rules permit the connection.
No counts on a channel
If a channel reports no events, verify the threshold and impedance settings for that channel. Check that the configured threshold is appropriate for the signal level and polarity, that the input impedance (50 Ω or Hi-Z) matches the source, and that the correct edge (rising or falling) is enabled.
Missing or discarded time tags
To sustain the full time-tag data rate, use a host computer with sufficient CPU, memory, and storage performance; an underpowered machine may be unable to keep up with the stream, resulting in dropped or discarded tags. Make sure the network link between the device and the host is correctly configured and provides adequate bandwidth — ideally a dedicated high-speed (10 GbE) connection with no competing traffic. Before running a measurement, verify the achievable throughput with a benchmarking tool such as iperf3.
Unstable or invalid timing
If timestamps appear unstable after selecting an external clock, confirm that a valid reference is present at the clock input and that the instrument has re-locked to it. Switching the clock source invalidates the time base until the lock completes.
13 Safety, Disposal, and Recycling
Read this section before installing or operating the LINTag. The notes below cover the principal handling and end-of-life considerations; observe all local regulations in addition to the guidance here.
Electrostatic-sensitive device
The LINTag contains electrostatic-sensitive components. Electrostatic discharge can damage the input stages and other circuitry. Handle the instrument and its connectors in an ESD-safe manner: use a grounded wrist strap and an ESD-protected work surface, and avoid touching the signal connectors directly. Do not exceed the specified input voltage range on any channel.
Power and operating conditions
Power the instrument only from the power supply unit delivered with it — an XP Power VES300PS24, an external 24 V / 12.5 A (300 W) supply. If the supply ever needs to be replaced, use exactly this model; fitting a different unit, even one with similar ratings, can damage the instrument, create a safety hazard, and voids the warranty. Always connect the PSU to the LINTag first and only then plug it into the mains, and switch off and unplug at the mains before disconnecting the supply from the instrument. Ensure the mains outlet matches the supply's rated input voltage, and keep the PSU in a dry, well-ventilated location so that it does not overheat.
Maintenance and repair
The LINTag contains no user-serviceable parts. Refer all repairs to Photonscore; do not attempt to open or service the instrument yourself, as doing so may cause damage and will void the warranty. The instrument is covered by a one-year warranty from Photonscore, during which repairs are carried out at no cost to you. For any service required after the warranty period has expired, please contact Photonscore. No routine maintenance is required under normal operation. The device software and FPGA firmware can, however, be upgraded; contact Photonscore to obtain the update file and apply it as described in the firmware-upgrade instructions.
Disposal and recycling
Do not dispose of the LINTag as unsorted municipal waste. At the end of its service life, dispose of the instrument in accordance with the applicable electrical- and electronic-equipment regulations in your jurisdiction.
14 Contact and Support
The LINTag is manufactured by Photonscore GmbH. For technical support, service requests, or sales enquiries, use the contact details below.
Postal address:Klosterwuhne 42, 39124, Magdeburg, Germany
Web:https://www.photonscore.de/contact
Documentation:https://docs.photonscore.de
Email:email@photonscore.de